

 Palantir$PLTR
Palantir after its Q3 2026 report: revenue +96%, new contracts +6% and a price of 60.0 times sales
On November 2 Palantir reported revenue of US$2,313 million and raised its 2026 guidance. This report reads the release and the official quarterly filing, the backlog, earnings quality and what the price demands, without concluding anything about what the stock will do.
When a company doubles its revenue, the useful question stops being how much it grew and becomes what is growing underneath: contracts, backlog, margin and the part of profit that repeats. This report puts into one reading what Palantir published on November 2, compares it with its eight previous reports and with other growth companies, and calculates what today's price assumes. The figures were checked on November 3 against the official quarterly filing.
01What the data say
On November 2, Palantir reported revenue of US$2,313 million (+96% year over year) and raised its 2026 guidance; the official quarterly filing, submitted on November 3, confirms each of those figures. What is not visible at a glance is that new contracts are growing far less than revenue. Three readings, none of them a verdict:
- The business accelerated and the accounting margin stopped rising. Revenue grew 96% (63% a year earlier), but the GAAP operating margin was 46.2%, 47.1% and 46.9% in the last three quarters. Q4 guidance implies +88%: the first guided slowdown in the series.
- New contracts are moving much slower than revenue. The value of contracts closed rose 6% year over year and the U.S. commercial backlog only 4% in the quarter, against +12% to +30% in the previous six. That backlog covered 8.2 quarters of commercial revenue; it now covers 6.6. And the accounting backlog reported in the quarterly filing (RPO) stayed at US$4,900 million, the same as in June.
- The price pays 60.0× trailing twelve-month revenue. To justify it with a 10% annual return, this page's expectations map asks for ≈ US$126 billion of revenue in 2036: 15 times the 2026 guidance.
Figures checked on November 3, 2026 against the official quarterly filing, submitted a day after the release: revenue, profits, shares, cash, balance sheet and nine-month cash flows match to the thousand dollars. What only the filing brings (accounting backlog, segment margins, investments) is in the section "What the quarterly filing adds". The filing is unaudited.
This report describes what was published and the current state of the figures. It does not say what the stock will do: that reading and the decision belong to the reader.
02What Palantir sells and to whom
Palantir sells software that connects an organization's scattered data, arranges it in a common model and lets its analysts and artificial-intelligence systems work on it. It does not sell data or its own hardware. Its platforms, according to the company, are four: Gotham, for defense and intelligence; Foundry, to integrate and analyze data for companies and governments; Apollo, to deploy and update software in any environment, including isolated ones; and AIP, its artificial-intelligence platform, launched in 2023.
The company reports two large groups of customers: government and commercial. Government includes defense and intelligence, and also civilian agencies. On that scheme, the quarter split as follows: U.S. government, 41.2% of revenue; U.S. commercial, 42.5%; rest of world, 16.3%. A year ago, U.S. commercial was 33.6% and rest of world 25.2%.
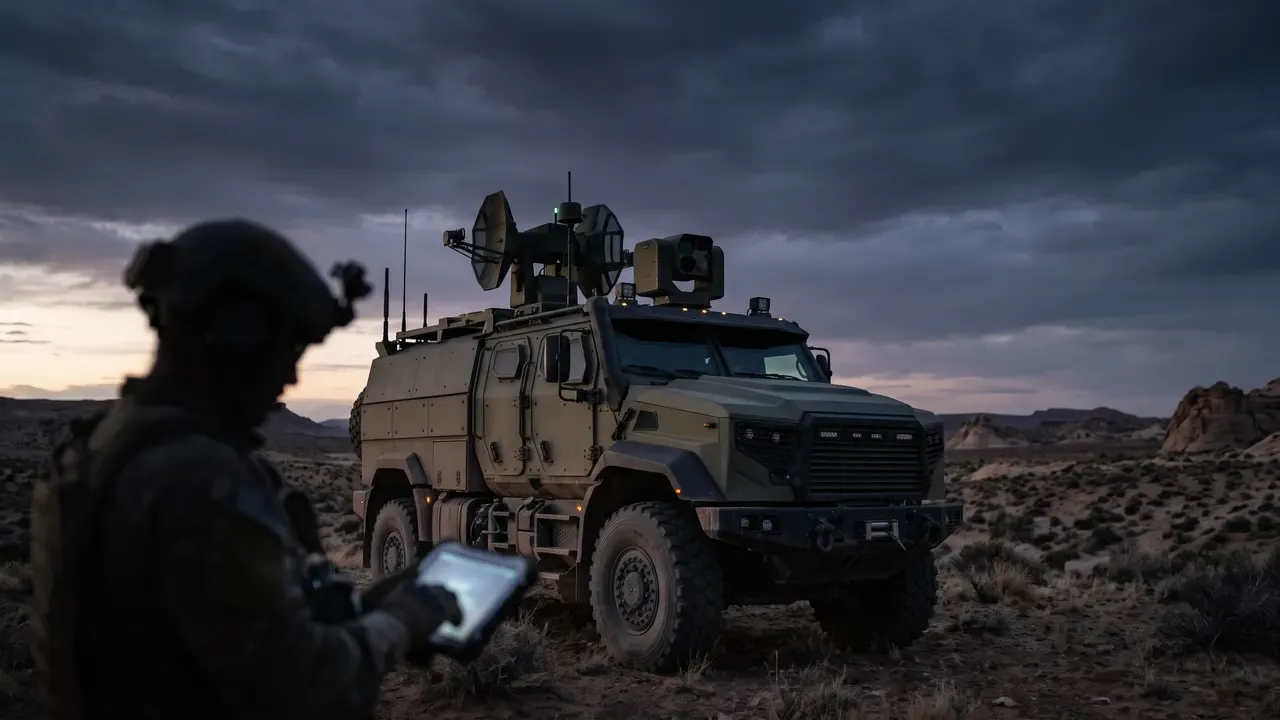
On its own site, Palantir presents TITAN as a ground vehicle "defined by AI" for the modern battlespace, and describes it as an access node to tactical intelligence. It is an example of where its defense offering is heading: from software installed on a server to software that travels inside a vehicle. This report does not quantify TITAN or any other program: the company does not publish its weight in revenue, and the quarter's contract figures do not separate them.
What it means for someone reading the figures: a large part of revenue depends on public budgets and government purchasing cycles, which move differently from a private company's. It is neither better nor worse in itself; it is a feature the report makes visible and worth keeping in mind when reading backlog and contracts.
03The November 2 report
Palantir published its Q3 2026 results after the market closed on November 2: that day the stock closed at US$178.34, 3.1% lower and before the figures were known. Revenue went from US$1,181 million to US$2,313 million; GAAP operating income from US$393 million to US$1,085 million; and the company exceeded US$2 billion of quarterly revenue for the first time. U.S. commercial revenue (US$984 million) surpassed U.S. government revenue (US$953 million) for the first time in the nine quarters covered by this report.
| Item | Q3 2026 | Q3 2025 | Change |
|---|---|---|---|
| Revenue | 2,313 | 1,181 | +95.9% |
| Cost of revenue | 383 | 207 | +84.9% |
| Gross profit | 1,930 | 974 | +98.2% |
| Operating expenses | 845 | 581 | +45.6% |
| Operating income (GAAP) | 1,085 | 393 | +175.9% |
| Operating margin (GAAP) | 46.9% | 33.3% | +13.6 pts |
| Net income attributable | 1,128 | 476 | +137.2% |
| Diluted EPS (US$) | 0.44 | 0.18 | +144% |
| Operating cash flow | 1,205 | 508 | +137.3% |
| Stock-based compensation | 319 | 172 | +85.1% |
| Diluted shares (millions) | 2,573.9 | 2,571.1 | +0.1% |
The guidance that accompanies the report weighs most in the reading. For Q4 the company expects revenue of US$2,649 to 2,653 million: +88% year over year and +15% versus Q3, below the +20% quarterly growth it just recorded. It is guidance the company itself sets and may or may not beat; here we only note what it implies.
| Item | Guidance | What it implies |
|---|---|---|
| Q4 2026 revenue | 2,649 – 2,653 | +88% y/y, +15% q/q |
| 2026 revenue | 8,530 – 8,534 | +91% vs 2025 |
| U.S. commercial revenue 2026 | above 3,559 | at least +143% |
| Adjusted operating income 2026 | 5,245 – 5,249 | ≈ 61.5% of revenue |
| Adjusted free cash flow 2026 | 4,800 – 5,000 | ≈ 57% of revenue |
04What the quarterly filing adds
The quarterly filing was submitted on November 3, a day after the release. Every figure this report takes from the release was checked: revenue, cost, operating income, net income, earnings per share, basic and diluted shares, cash, investments, receivables, equity, operating cash flow and stock-based compensation for the nine months. All of them match. The figures that exist only for the quarter (operating cash flow of US$1,205 million, equipment spending of US$8 million and stock-based compensation of US$319 million) come from subtracting the six months from the filing's nine-month figure, and they match too. This is what the filing brings and the release does not:
| Item (basis) | Now | Before |
|---|---|---|
| Government segment revenue (Q3) | US$1,146 million | US$633 million (Q3 2025) |
| Commercial segment revenue (Q3) | US$1,168 million | US$548 million (Q3 2025) |
| Government segment contribution (Q3) | 70% | 66% (Q3 2025) |
| Commercial segment contribution (Q3) | 77% | 66% (Q3 2025) |
| Total contribution (Q3) | 73% | 66% (Q3 2025) |
| Accounting backlog, RPO (Sep 30) | US$4,900 million | US$2,600 million (Sep 30, 2025) |
| Contract liabilities: deferred revenue and customer deposits (Sep 30) | ≈ US$1,200 million | ≈ US$800 million (Dec 31, 2025) |
| Listed-company shares held (Sep 30) | US$185 million | US$23 million (Dec 31, 2025) |
| Customers with more than 10% of revenue | none | none |
Contribution by segment rose in both: government from 66% to 70% and commercial from 66% to 77%. In the quarter, commercial segment revenue (US$1,168 million, +113%) exceeded government segment revenue (US$1,146 million, +81%); a year earlier it was the other way round. The "government" segment includes governments outside the U.S.; that is why it does not match the U.S. government figure this report uses (US$953 million).
Accounting backlog (RPO) is contracted, noncancelable revenue not yet recognized. Palantir states that many customers can terminate their contracts with less than twelve months' notice, and that those amounts, like customer deposits, do not count as RPO. That is why it is a different measure from the release's RDV, which is the company's own metric and not an accounting measure. RPO was US$4,900 million at September 30, the same as at June 30 (the company rounds to US$100 million) and +88% from September 2025. Of that total, ≈ 44% will be recognized in the next 12 months (≈ US$2,200 million), ≈ 37% in months 13 to 36 (≈ US$1,800 million) and the rest afterwards. If revenue over the next 12 months were four times Q4 guidance (≈ US$10,600 million), the RPO for that period would equal ≈ 20% of it. This is not a defect: the company explains it in its own filing. It is the measure of how much of next year's revenue is already signed and cannot be cancelled, and this quarter it did not grow.
05Who is buying: where the growth comes from
The fashionable question is whether Palantir depends on the government. The revenue figures say something more precise: the U.S. government weighs the same as a year ago (41.2% of the total versus 41.2%) and is growing faster than before (+96% versus +52%). What changed is the split of the rest: U.S. commercial rose from 33.6% to 42.5% of revenue and the rest of the world fell from 25.2% to 16.3%.

Rest of world is the slow part: US$376 million in the quarter, +26% year over year and +4% versus the previous quarter, while the total grows 96% year over year. The "sovereign AI" narrative in the CEO letter is not yet visible in the international figure. A limit of these data: the release does not separate government outside the U.S., so "government" here is U.S. only.
06Contracts: what builds up and what slows
Today's revenue comes from contracts signed earlier; today's contracts announce tomorrow's revenue. Palantir publishes two measures: contracts closed in the quarter (TCV) and the value left to recognize on U.S. commercial contracts (RDV, its commercial backlog). Both slow at the same time in Q3.
| Quarter | Backlog (RDV) | Quarterly change | U.S. commercial revenue | Coverage |
|---|---|---|---|---|
| 4T24 | 1,790 | — | 214 | 8.4 |
| 1T25 | 2,320 | +30% | 255 | 9.1 |
| 2T25 | 2,790 | +20% | 306 | 9.1 |
| 3T25 | 3,630 | +30% | 397 | 9.1 |
| 4T25 | 4,380 | +21% | 507 | 8.6 |
| 1T26 | 4,920 | +12% | 595 | 8.3 |
| 2T26 | 6,238 | +27% | 764 | 8.2 |
| 3T26 | 6,517 | +4% | 984 | 6.6 |
U.S. commercial revenue grew 29% in the quarter and the backlog behind it, 4%: that is why coverage fell from ≈ 8.2 to 6.6 quarters. Palantir turns backlog into revenue quickly, so lower coverage is not an alarm by itself; it is the figure most worth watching in the next reports. A nuance: the release does not say how much of the total backlog is government. The quarterly filing shows contracted performance obligations (RPO) of US$4,900 million at September 30, unchanged from June (+88% year over year); the section "What the quarterly filing adds" details them.
07The business: where each dollar goes
The company presents an adjusted operating margin of 62%, which adds back stock-based compensation (US$319 million in the quarter) and its related taxes. Both figures are legitimate and answer different questions: the adjusted one measures the business before paying employees in stock; the GAAP one, after. Operating expenses grew 46% against 96% for revenue, and gross margin rose from 82.4% to 83.4%.
08Earnings quality and balance sheet
Three traits qualify the US$1,128 million of profit. First, it paid 1.2% in taxes (stock payments to employees and prior-year losses reduce the tax), so the 49% net margin is not a permanent level. Second, stock-based compensation remains a real cost: US$319 million in the quarter, 13.8% of revenue (14.6% a year earlier). Third, cash backs profit: over nine months operating cash flow (US$3,320 million) was 108% of net income.
| Indicator | Basis | Value |
|---|---|---|
| GAAP operating margin | Q3 2026 | 46.9% |
| Operating margin adjusted by the company | Q3 2026 | 61.7% |
| Stock-based compensation / revenue | Q3 2026 (Q3 2025) | 13.8% (14.6%) |
| Taxes / pre-tax income | Q3 2026 (Q3 2025) | 1.2% (0.8%) |
| Free cash flow after stock-based compensation | Q3 2026 | US$878 million (38%) |
| Days sales outstanding | Q3 2026 · Q2 2026 · Q3 2025 | 75 · 70 · 78 |
| Return on invested capital (ROIC) | 12 m to June 2026 | 33.1% |
| Piotroski score (Q-Forensics™) | Annual 2025 | 7 of 9 |
The Piotroski score of 7 out of 9 loses two points for reasons its own design explains: "less leverage" cannot improve at a company with no debt, and "no dilution" fails because the average share count rose. Days sales outstanding oscillate between 68 and 78 over the last six quarters with no clear trend.
| Item | Sep 30, 2026 | Dec 31, 2025 |
|---|---|---|
| Cash and equivalents | 3,619 | 1,424 |
| Marketable securities | 6,942 | 5,753 |
| Accounts receivable | 1,883 | 1,042 |
| Deferred revenue and customer deposits (current) | 1,174 | 766 |
| Total assets | 13,413 | 8,900 |
| Total liabilities | 2,068 | 1,412 |
| Stockholders' equity | 11,228 | 7,387 |
Cash and investments total US$10,562 million (79% of assets) and there is no debt. On shares, the quarter's basic average was 2,405.7 million (+1.2% year over year) and the diluted one 2,573.9 million (+0.1%): outstanding instruments (options and shares to be delivered) add 168 million shares, 7% more than basic. This page's enterprise value uses diluted shares.
09What the market pays today
At US$173.90 per share, enterprise value is US$437.0 billion (diluted market capitalization of US$447.6 billion less US$10.6 billion of cash and investments). That is 60.0× trailing twelve-month revenue and 51.2× 2026 guidance. A year ago, on the previous report day, the multiple on trailing twelve-month revenue was 135×: the price fell 16% while trailing twelve-month revenue rose 87%.
| Measure | Value |
|---|---|
| Price per share | US$ 173.90 |
| Market capitalization (diluted shares) | US$447.6 billion |
| Cash and investments | US$10.6 billion |
| Enterprise value | US$437.0 billion |
| Value / trailing 12-month revenue | 60.0× |
| Value / 2026 guided revenue | 51.2× |
| Market capitalization / trailing 12-month net income | ≈ 122× |
| 2026 guided adjusted free cash flow / capitalization | 1.1% |
| That flow, subtracting stock-based compensation (≈) | ≈ 0.8% |
- Palantir
 AppLovin
 NVIDIA
 CrowdStrike
 Snowflake
 ServiceNow
| Company | Value / revenue | Revenue growth | Operating margin |
|---|---|---|---|
| Palantir | 60.0× | 87% | 46% |
| AppLovin † | 14.9× | 76% | 76% |
| NVIDIA † | 23.4× | 83% | 60% |
| CrowdStrike † | 51.7× | 24% | −6% |
| Snowflake † | 22.3× | 32% | −31% |
| ServiceNow † | 8.9× | 22% | 14% |
The table does not say who is well or poorly valued: it puts three numbers side by side to see what is paid for each combination. AppLovin and NVIDIA grow comparably with higher operating margins; CrowdStrike has a close multiple but grows at a quarter of the rate and has no accounting margin. Palantir is the only one combining the group's highest multiple with an accounting margin that is already positive and high.
10What you would have to believe
A price is a bet on the future. The inverse method does not ask what the stock is worth: it asks what future today's price assumes. We fix the annual return the buyer would demand, assume free cash flow (after taxes and stock-based compensation) is 35% of revenue, and calculate the growth that fits US$173.90. The table is neither a forecast nor a valuation by Quantika Research: it is the inverse reading of the price.
| If the buyer demands… | 10% a year | 12% a year | 14% a year |
|---|---|---|---|
| 2027 revenue growth | 60% | 71% | 80% |
| Average annual growth 2026–2036 | 31% | 36% | 40% |
| 2031 revenue | US$60 billion | US$78 billion | US$98 billion |
| 2036 revenue | US$126 billion | US$182 billion | US$247 billion |
| Times 2026 guided revenue | 15× | 21× | 29× |
For scale: 2026 guided revenue is US$8,532 million. With a required return of 10% a year, today's price assumes growing 60% in 2027 and 31% on average for ten years, to ≈ US$126 billion. With 12%, ≈ US$182 billion. The higher the return asked for, the more growth is needed to fit the same price. A reader with another rate or margin gets another row; that is why the table shows three.
11Price, executives and options

Before the report, the stock closed at US$178.34: 16% below its 52-week high (US$212.94), 68% above its low (US$106.37), below its 50-day average (US$186.87) and above the 200-day (US$153.57). Its two-year beta is 2.5: it has historically moved 2.5 times the market. At 12:15 New York time on November 3, 2026, mid-session and ~15 minutes delayed, it trades at US$173.90 (−2.5% from that close).
| Report | Close on report day | Next day |
|---|---|---|
| 3 nov 2025 | US$ 207.39 | −8.1% |
| 2 feb 2026 | US$ 147.78 | +6.8% |
| 4 may 2026 | US$ 146.12 | −6.9% |
| 3 ago 2026 | US$ 125.89 | +29.2% |
| Nov 2, 2026 | US$ 178.34 | −2.5% (mid-session, 12:15 ET) |
In the four previous reports the next-day move was, in absolute value, 7.5% (median) and 12.8% (average), including a +29.2% jump in August from a recent low. On November 2, before the report, options expiring November 6 priced a move of ≈ ±13% (the cost of buying a call and a put at the then price was ≈ US$23, computed with each contract's last traded price). The November 3 move (Nov 3, 12:15 ET) is −2.5%. It is market data, not a forecast of direction.
At the close of November 2, among options expiring in the following 45 days, the largest open interest is in calls at the US$200 strike (20,573 contracts) and in puts at US$155 (12,449). A wall shows where positioning is concentrated; it is not a forecast.
Between July 15 and October 28, 7 executives sold 624,390 shares for ≈ US$108.8 million in 50 transactions; the chief executive sold 492,348 of them (≈ US$86.1 million, 79% of the total). Together they equal 0.03% of shares. There were no open-market purchases in that period, and on October 28 share awards were recorded for three executives (987,246 shares). Executive sales have many motives, including pre-arranged plans and tax payments on shares received; this data does not say which applies.
12What to watch and what these data do not answer
What Palantir published sets a list of figures worth watching when the Q4 report and the following ones come out. They are not forecasts: they are the questions the accounts leave open.
| What to watch | What it already showed | When it is known |
|---|---|---|
| Total contracted backlog (RPO) | US$4,900 million at Sep 30, same as June (+88% y/y) | Q4 report (February 2027) |
| U.S. commercial backlog (RDV) and coverage | +4% q/q; coverage 6.6 quarters | Q4 report (February 2027) |
| Contracts closed (TCV) | +6% y/y in Q3 | Q4 report |
| GAAP operating margin | 46.9% after three quarters near 47% | Q4 report |
| Q4 revenue versus guidance | Guidance: US$2,649–2,653 million | Q4 report |
| Effective tax and stock-based compensation | 1.2% and 13.8% of revenue | Every report |
| Revenue outside the U.S. | +26% y/y, 16.3% of the total | Every report |
What these data do not answer: what the stock price will do after the report or in the coming months; how much of the total backlog is government; whether contract growth recovers or keeps falling (one quarter of TCV is little); or whether the accounting margin rises again. Nor do they say whether the current price is high or low: only what it assumes.
Sources
- Palantir Technologies Inc. earnings releases, Q3 2024 to Q3 2026Source of revenue by origin, income statement, balance sheet, cash flow, stock-based compensation, contracts closed (TCV), U.S. commercial backlog (RDV) and guidance. Figures in millions of dollars, rounded.
- Palantir annual and quarterly reportsQ3 2026 quarterly report, submitted on November 3, 2026 (unaudited): financial statements, segments, contracted performance obligations (RPO), investments and shares outstanding. Earlier reports: RPO since 2024 and accounts from Q2 2025 to Q2 2026.
- Quantika Research Q-Ledger™, Q-Pulse™, Q-Forensics™, Q-Data Engine™ and Q-PathEngine™Extraction of the figures, quality indicators, price, options, executive transactions and the expectations map (reverse DCF), with prices at 12:15 New York time on November 3, 2026, mid-session and ~15 minutes delayed (options and executive transactions at the November 2 close).
- † Third-party figuresMultiples, growth and margin of AppLovin, NVIDIA, CrowdStrike, Snowflake and ServiceNow: own calculation with each company's latest report.
Method note
Figures in millions of dollars, rounded; because of rounding, a sum may differ by a million. The ≈ symbol marks own estimates: trailing twelve-month net income (≈ US$3,660 million) adds the first nine months of 2026 and Q4 2025, and 2026 stock-based compensation adds ≈ US$330 million for Q4. "Rest of world" is the total minus the U.S. and does not separate government. The expectations map is a model, not a forecast or a valuation. Palantir's price and the comparables' are those at 12:15 New York time on November 3, 2026, mid-session and ~15 minutes delayed; the pre-report close was US$178.34. Options and executive transactions are from before the report. An options wall shows where positioning is concentrated: it is not a forecast. Quantika Research holds no position in the stocks mentioned that must be disclosed. Nothing in this report is an investment recommendation.