 Netflix$NFLX
Netflix after its Q3 2026 report: more margin, less growth and a multiple cut in half
Netflix reported on October 20 a quarter with more earnings but slower growth and a lower margin guide, and its stock fell. This report reads its accounts, its price and its peers without concluding anything about what the stock will do.
When a company beats expectations and its stock falls, the explanation is not in the quarter: it is in what the company said about the next one and in what the market was paying before. This report brings together in one reading the figures Netflix published, the path of its price and the comparison with its closest peers.
01What the data say
Netflix beat expectations on earnings and its stock fell 5.3% the next day: the reaction reflects what the company expects for the coming months, not the quarter itself. Three readings of the numbers, none of them a verdict:
- The business is growing and earning more; the price is not. Over 12 months the price fell 41% while operating income rose 23%: the P/E went from ≈ 45x to ≈ 22x recurring earnings. The EBITDA margin is 32% and net debt is 0.4x EBITDA.
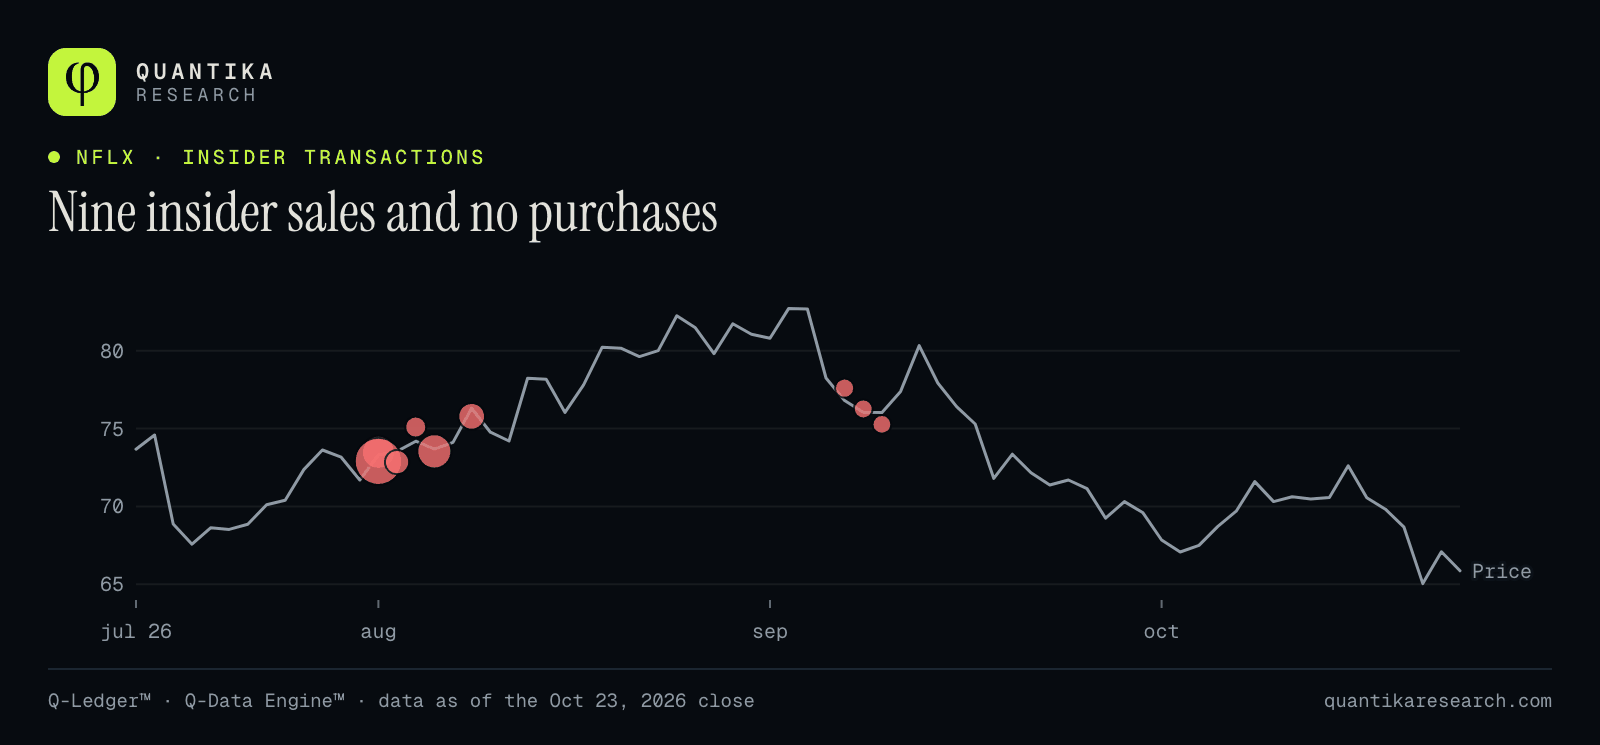
- The pace is cooling. Revenue grew 11.8% in Q3 (17.2% a year earlier), the advertising target came down and Q4 guidance carries a lower margin. Five reports in a row closed lower the next day (average −7.0%).
- The price is near its lows. It trades below its 20-, 50- and 200-day averages and below every VWAP; the RSI (37) is not oversold and the MACD remains below its signal line.
This report describes what happened and the current state of the figures. It does not say what the stock will do: that reading and the decision belong to the reader.
02The October 20 report
Netflix reported revenue of $12,874 million (+11.8% year over year), operating income of $4,459 million and diluted earnings per share of $0.87, versus $0.59 a year earlier. Earnings per share beat the consensus (≈ $0.82 to $0.83)† and revenue matched expectations.
| Item | Q3 2026 | Q3 2025 | Change |
|---|---|---|---|
| Revenue | 12,874 | 11,510 | +11.8% |
| Operating income | 4,459 | 3,248 | +37.3% |
| Operating margin | 34.6% | 28.2% * | +6.4 points |
| Net income | 3,664 | 2,547 | +43.9% |
| Diluted EPS ($) | 0.87 | 0.59 | +47% |
| Free cash flow | 2,884 | 2,661 | +8.4% |
| Share repurchases | 4,797 | 1,857 | +158% |
The reaction reflects the guidance, not the quarter. The 2026 advertising revenue target came down from ≈ $3,000 million to ≈ $2,700 million on a slower rollout of the tools; the margin guided for Q4 is 26.0% (24.5% a year earlier) and includes ≈ 1.2 points from cutting ≈ 6% of headcount; Q4 earnings per share guidance ($0.67) came in below the consensus (≈ $0.73)†; and 2026 free cash flow guidance fell from ≈ $12,500 million to ≈ $12,000 million.
| Item | Q4 2026 | Full year 2026 |
|---|---|---|
| Revenue | 13,442 (+12%) | 51,100 (+13%) |
| Operating margin | 26.0% | 31.5% |
| Diluted EPS ($) | 0.67 | not given |
| Free cash flow | — | ≈ 12,000 (was ≈ 12,500) |
| Advertising revenue | — | ≈ 2,700 (was ≈ 3,000) |
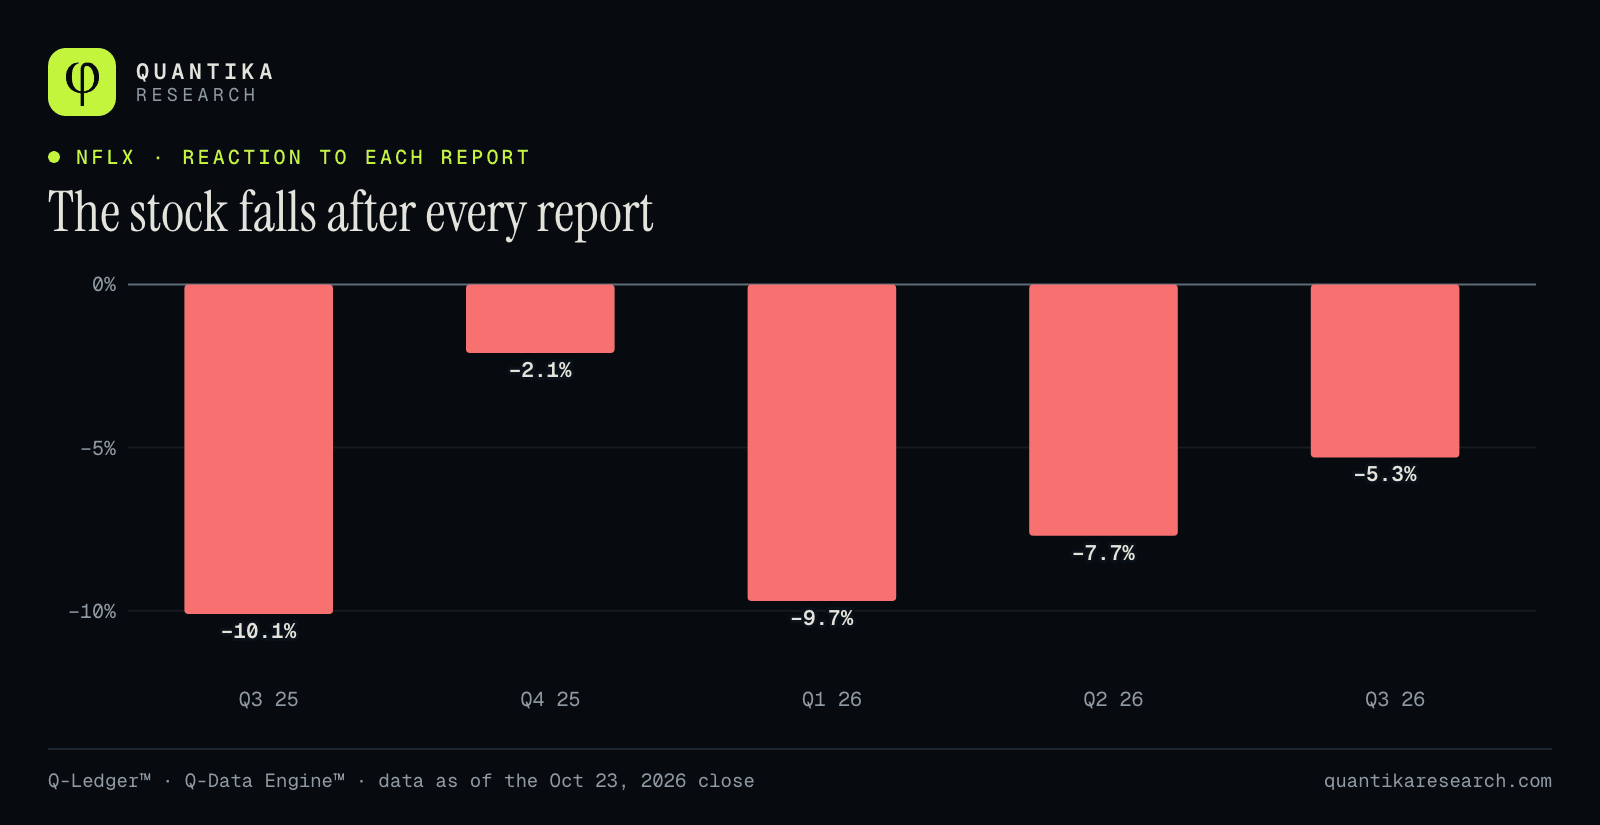
It is the fifth consecutive drop the day after a report (average −7.0%). October’s was the mildest and the one with the least selling volume: 101 million shares versus 126 to 148 million in the other four. It describes the past: it does not say how the next one will go.
03The business: where each dollar goes
Of every 100 dollars of revenue over the last 12 months, 49 goes to cost of revenue, 19 to technology, marketing and administration and 31 remains as operating income. Net income (29.7 per 100) lands close to operating income because the one-off fee offsets interest and taxes.
Annual growth slowed from 17.2% to 11.8% in a year and Q4 guidance implies ≈ 11.5%. The slowdown is orderly —the company says subscription cancellations improved— but it is what weighs most on the multiple today.
The 34.6% in Q3 looks much better than the 28.2% a year earlier, but that comparison misleads: Q3 25 included the Brazil charge and, without it, the real improvement is ≈ 1 point. For 2026 the company expects 31.5%, versus 30.9% in 2025 excluding the charge (+0.6 points): the margin expansion that drove earnings between 2023 and 2025 is slowing.
04Earnings, cash and balance sheet
In Q1 26 Netflix booked a one-off gain of ≈ $2.8 billion before taxes: the fee Paramount paid when Netflix withdrew its offer for Warner Bros. Discovery†. That gain flows into net income and also into the quarter’s operating cash flow, which nearly doubled (from $2,789 million to $5,290 million). That is why the P/E and free cash flow yield shown by automated indicators look better than the recurring ones.
| Item | Reported | Recurring ≈ |
|---|---|---|
| Net income, 12 months | $14.8 billion | ≈ $12.6 billion |
| Basic EPS | $3.51 | ≈ $2.98 |
| P/E | 18.8x | ≈ 22x |
| Free cash flow, 12 months | $11.4 billion | ≈ $9.2 billion |
| Free cash flow yield | 4.1% | ≈ 3.3% |
Over 12 months Netflix repurchased $12.9 billion of shares (4.7% of its market value), more than recurring free cash flow, and Q3 26 was its largest buyback quarter ($4.8 billion); $22.3 billion remains authorized. Diluted shares fell 4.2% in two years (4,379 to 4,195 million).
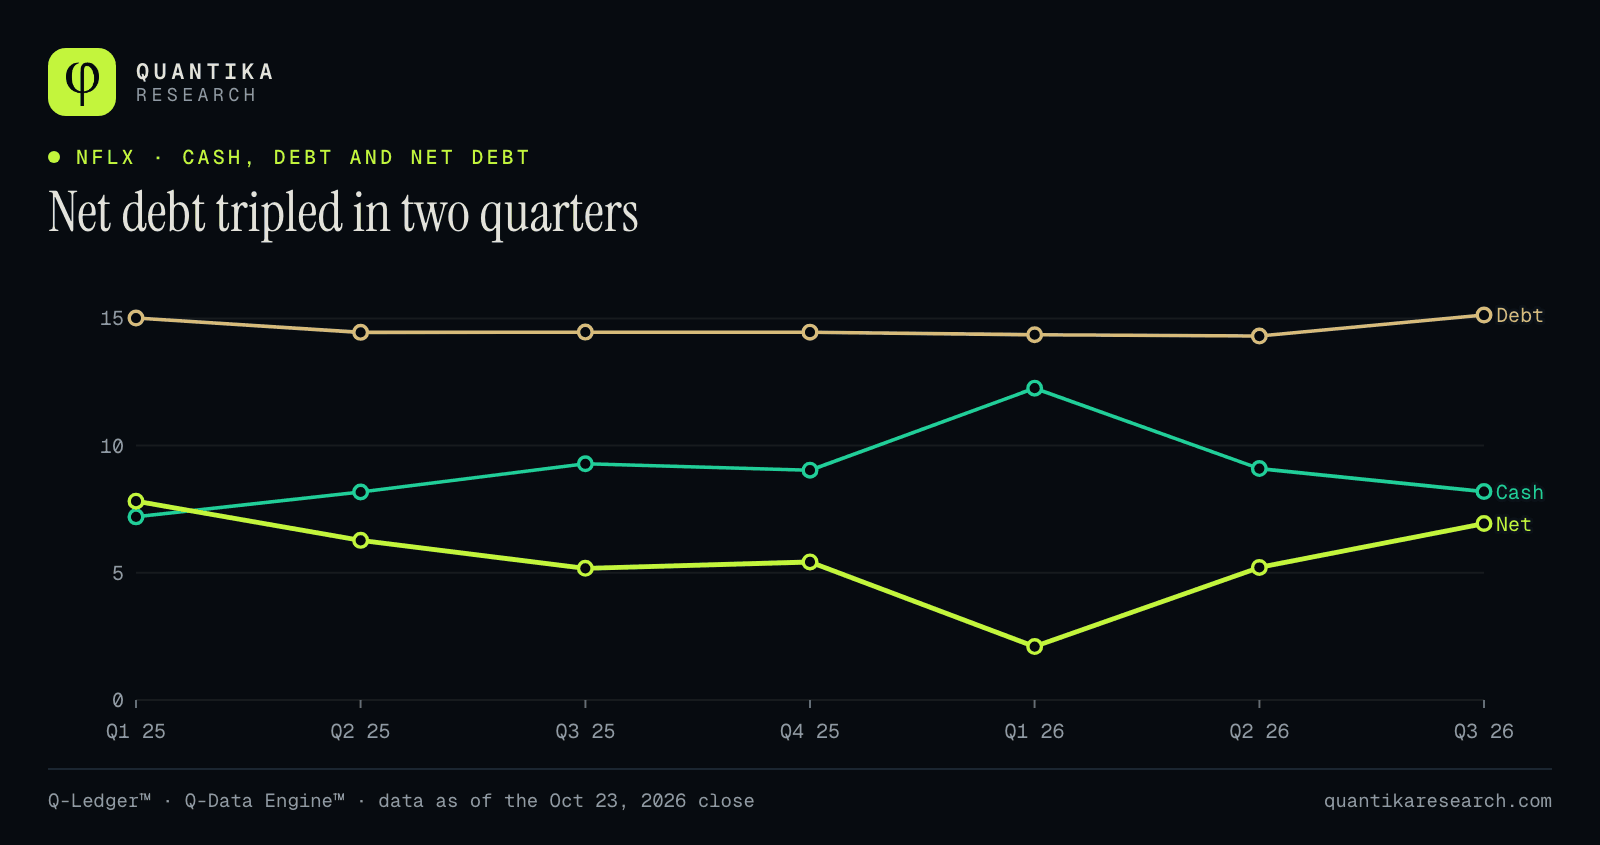
Because the pace of buybacks exceeded recurring free cash flow, net debt rose from $2.1 billion (Mar-26) to $6.9 billion (Sep-26). Even so the balance sheet is roomy: net debt of 0.4x EBITDA, a Piotroski strength score of 7 out of 9 and an Altman Z of 8.4 (the safe zone starts at 3). On content it invested $1.17 in cash per dollar of amortization over nine months and, in Q3, billed $2.50 per dollar invested.
| Result | Criteria |
|---|---|
| Pass | Positive net income · positive operating cash flow · ROA improved · long-term leverage fell · no share dilution · gross margin improved · asset turnover improved |
| Fail | Operating cash flow above net income · current ratio improved |
05Valuation: the multiple was cut in half
At the October 23 close, Netflix trades at 18.8x its 12-month earnings, or ≈ 22x recurring earnings, and at 17.6x EBITDA. A year ago the P/E was ≈ 45x. Over that span the price fell 41% while 12-month operating income rose 23%, from $12.6 billion to $15.6 billion: the decline came from the multiple, not from earnings.
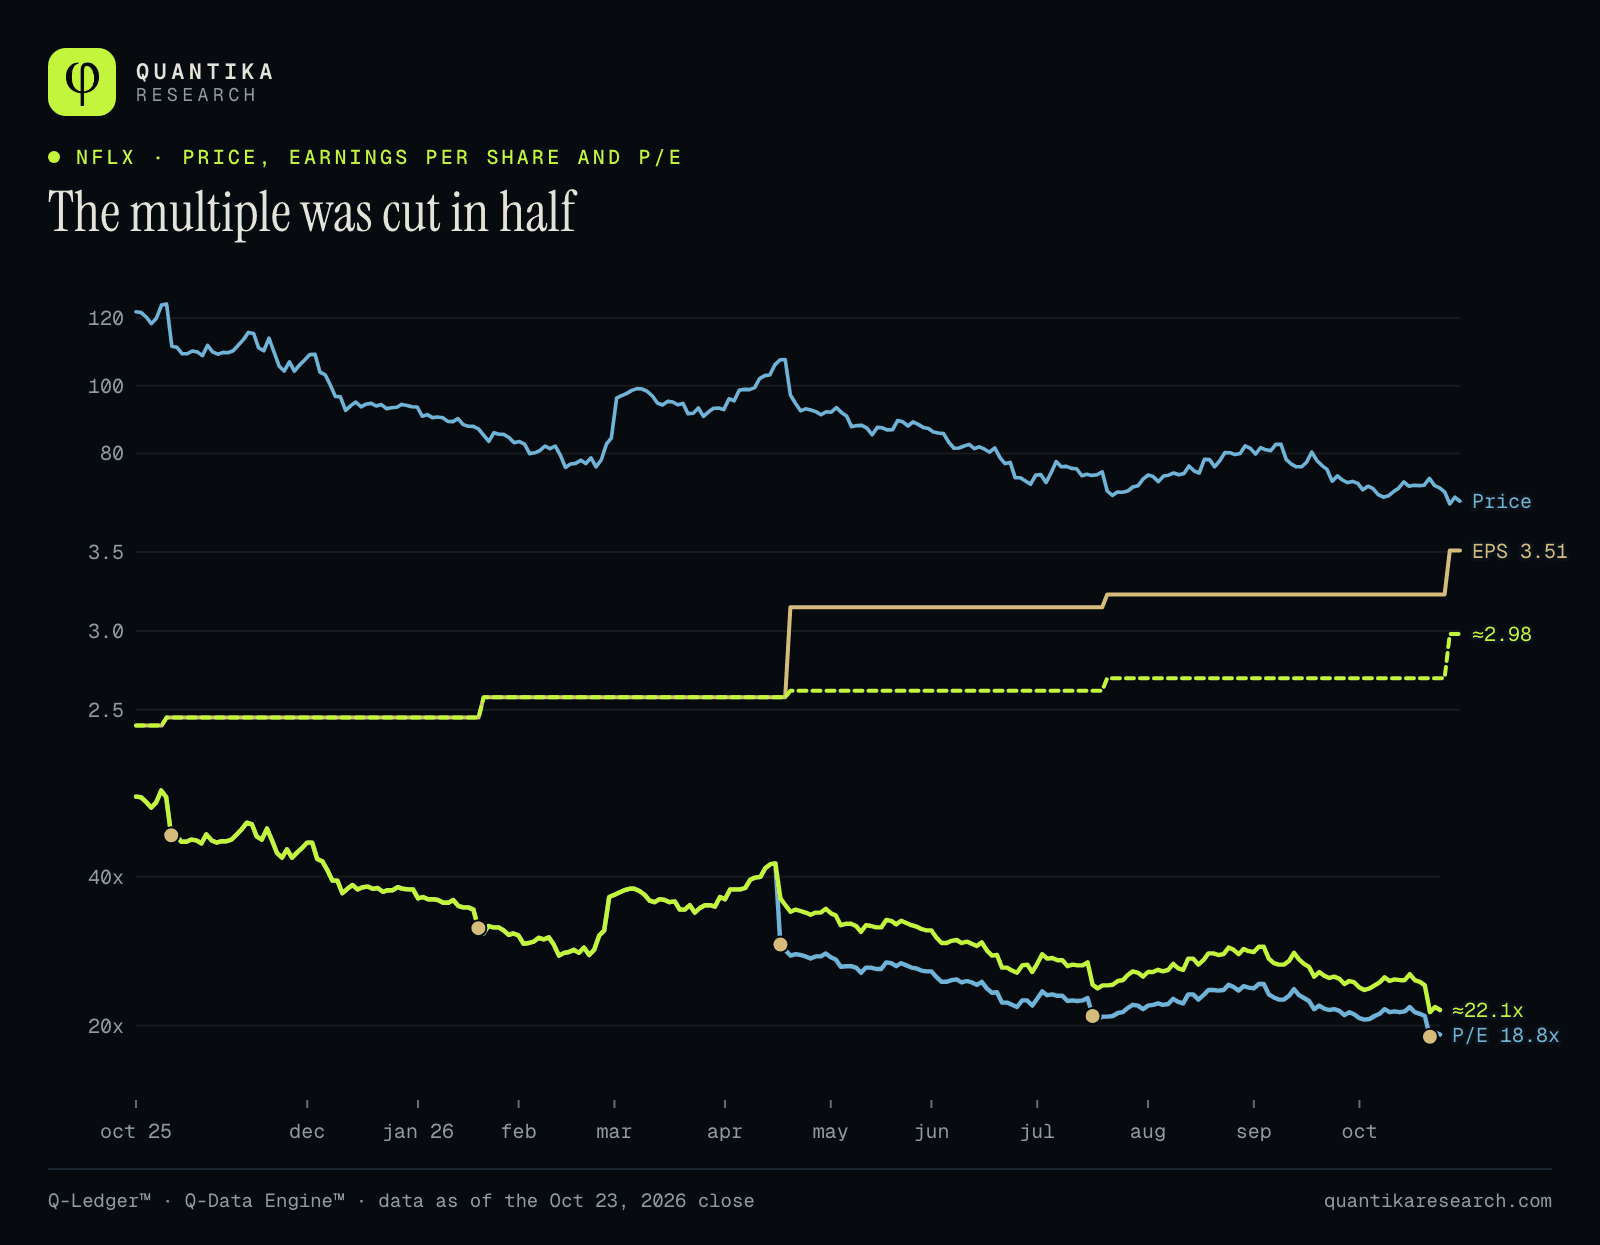
The multiple summarizes what the market expects from growth: less expected growth, fewer years of earnings paid. It does not say whether the current price is high or low; it says it is half of what it was against the same accounts.
| Multiple | Today |
|---|---|
| P/E (12-month earnings) | 18.8x · ≈ 22x recurring |
| Price / book value | 9.3x |
| Price / sales | 5.5x |
| Enterprise value / sales | 5.7x |
| Enterprise value / EBITDA | 17.6x |
| Price / free cash flow | 24.1x |
| Earnings yield (E/P) | 5.3% |
| Free cash flow yield | 4.1% · ≈ 3.3% recurring |
06Price, volume and positioning
Four indicators over a year of sessions. VWAP is the average price at which volume traded over a period: if the price is below it, those who bought in that period are, on average, at a loss. The RSI compares the strength of recent gains and losses (below 30 is considered oversold). The MACD compares two price averages and their signal line.
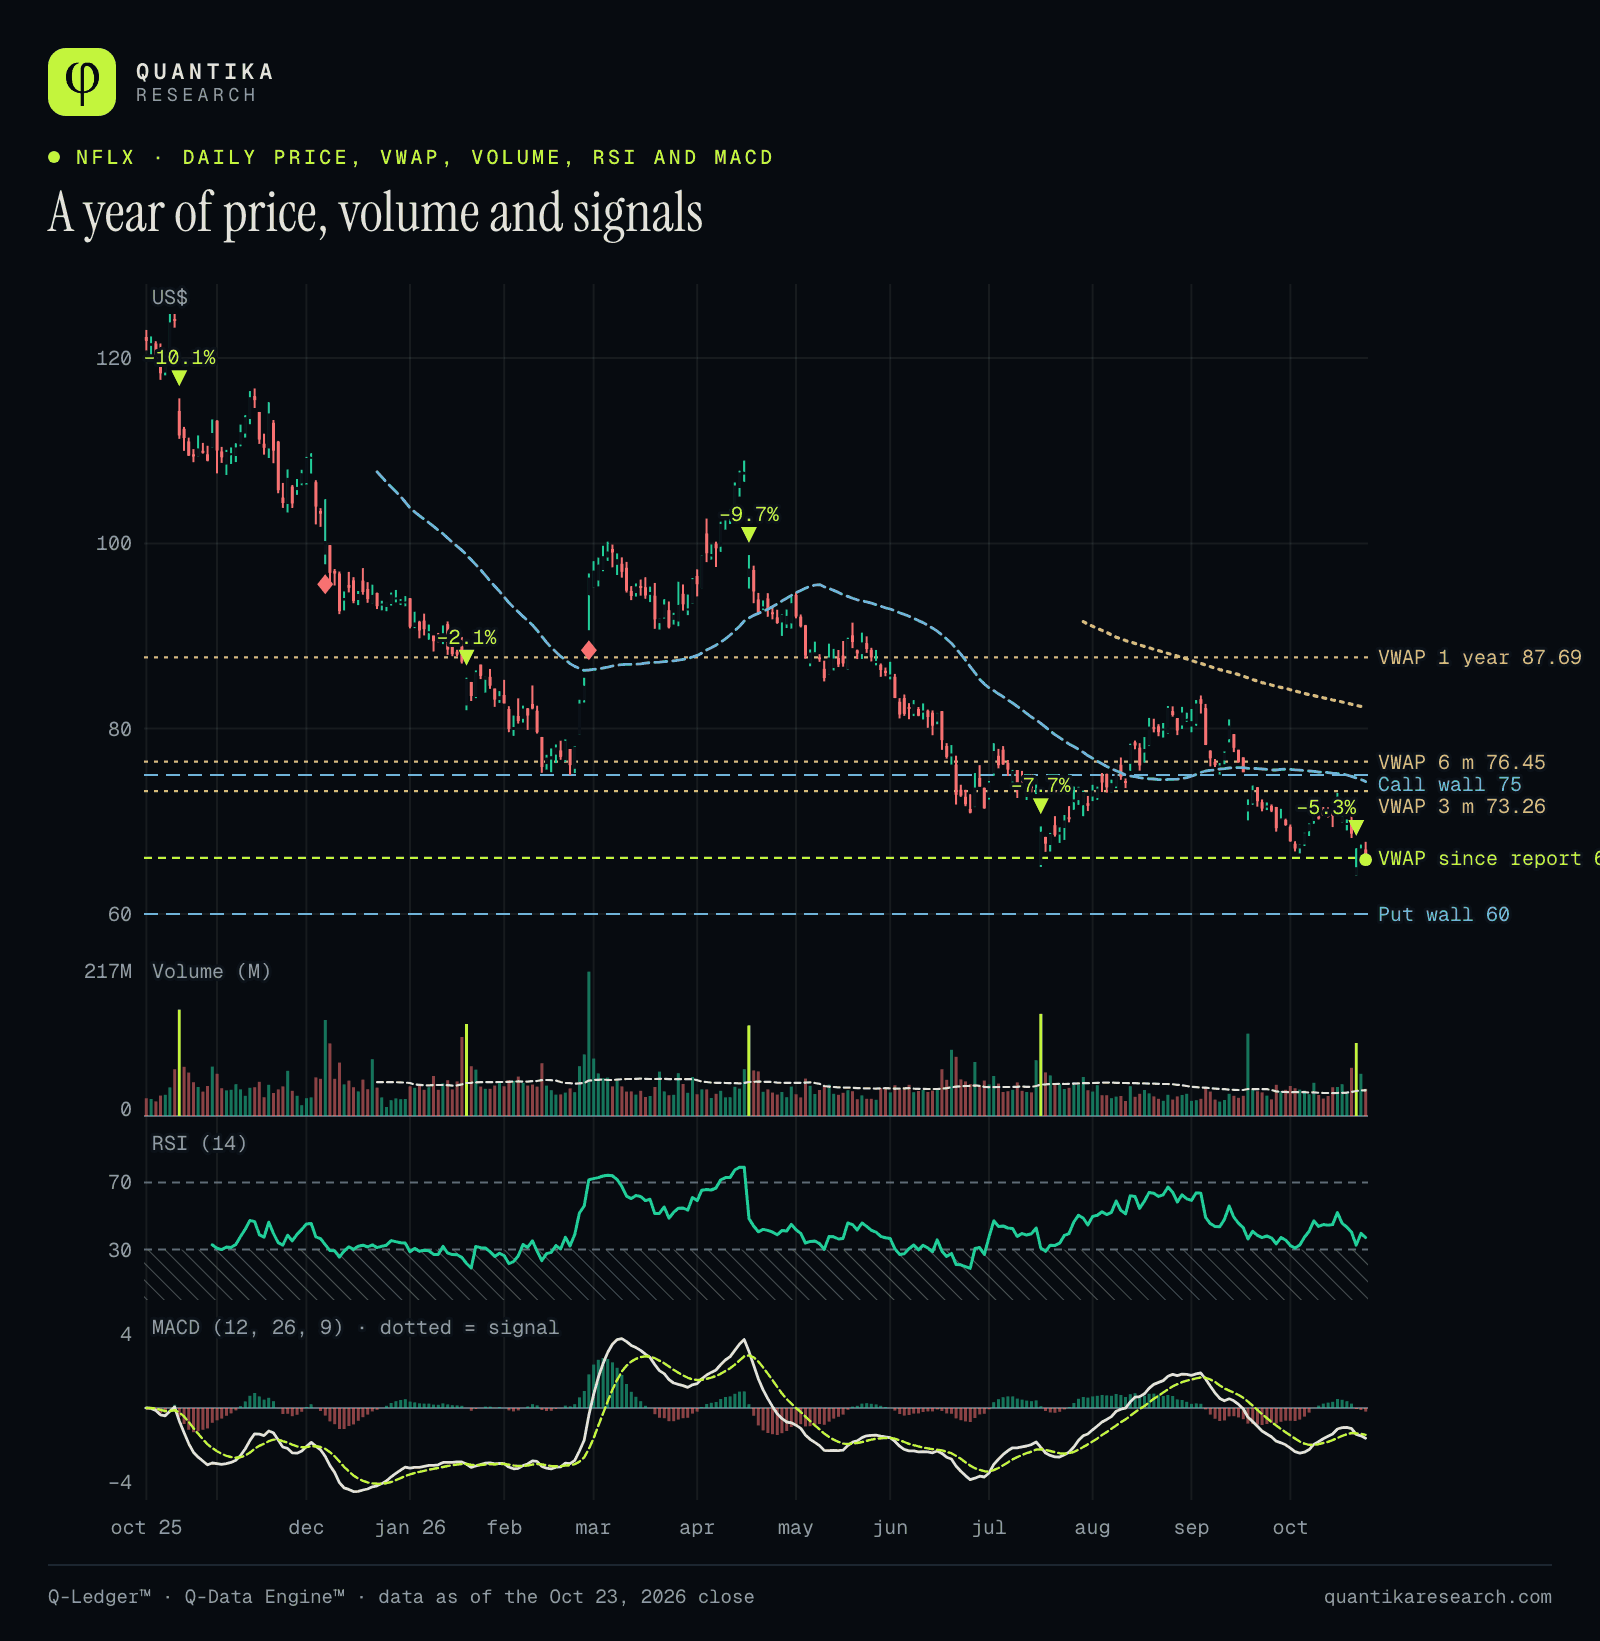
- Averages: the price trades 4.8% below its 20-day average ($69.16), 11.3% below the 50-day ($74.27) and 19.9% below the 200-day ($82.27). The 52-week low ($64.10) was on October 21 and it is now 2.8% above it.
- VWAP: all of them sit above the price. Whoever bought on average over the last year is ≈ 25% down; the price is now right above the post-report VWAP ($66.07).
- Volume: on report day 101 million shares traded, the lowest selling volume of the last five reports; on Friday, 37.9 million, below the 20-day average (42.4). Over 20 sessions the volume on down days was 1.45 times that of up days.
- RSI and MACD: RSI of 37.2, outside the oversold zone; its low for the year was 18.8 (June 25). The MACD (−1.74) has been below its signal (−1.53) since October 21.
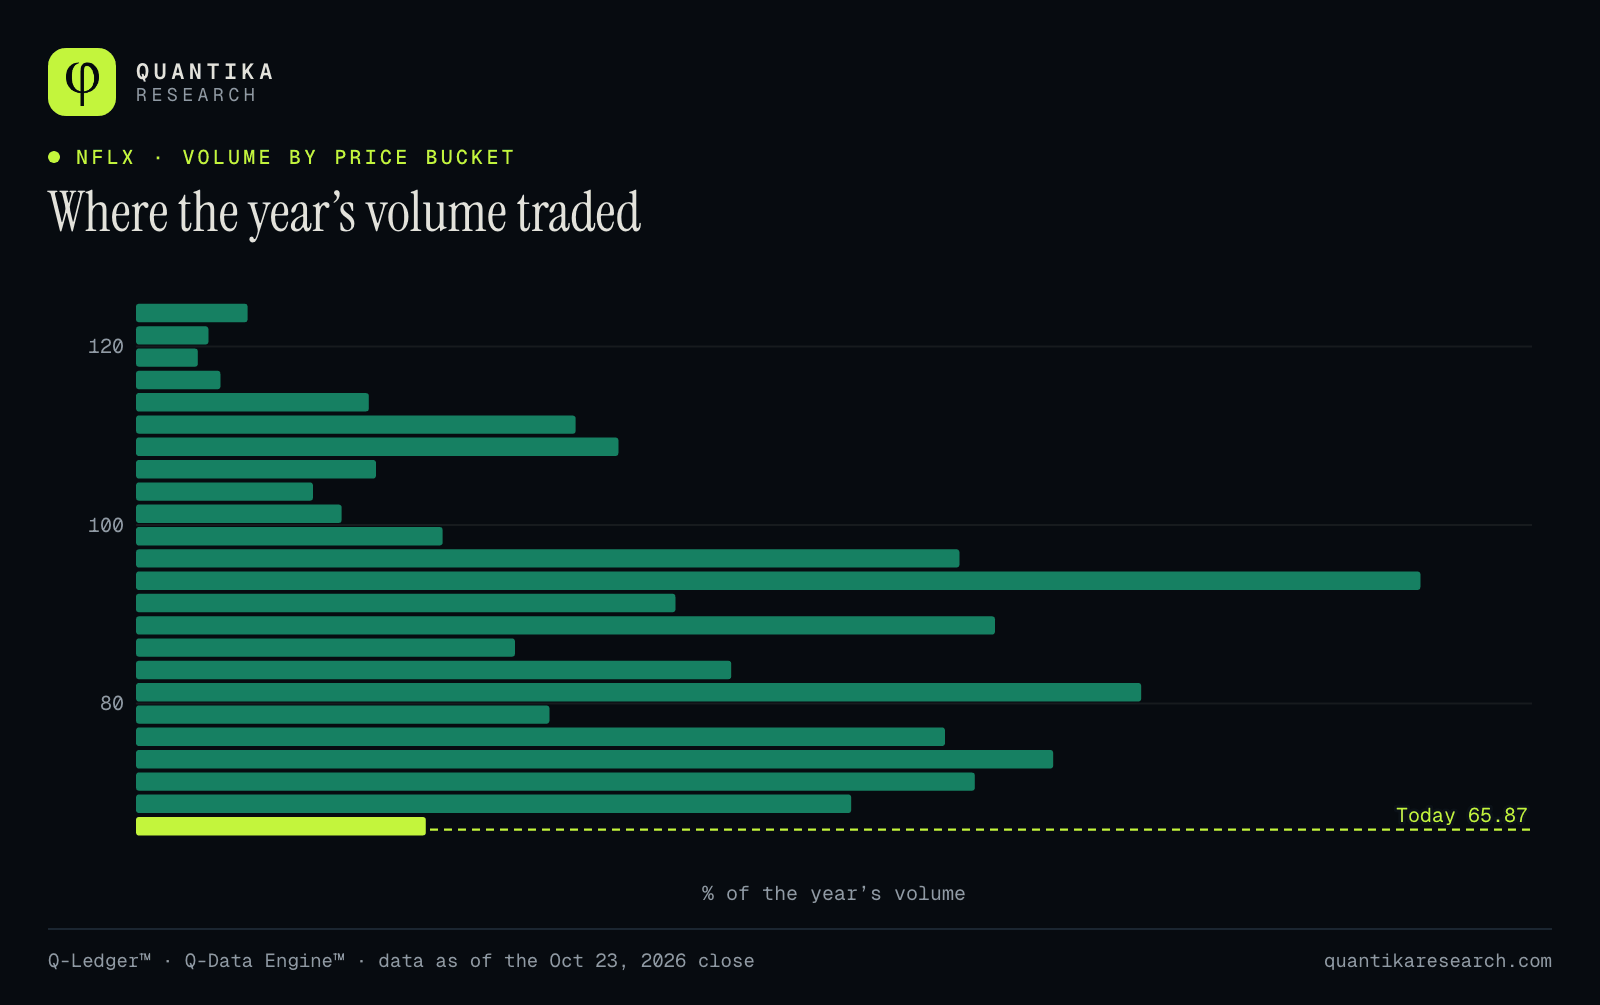
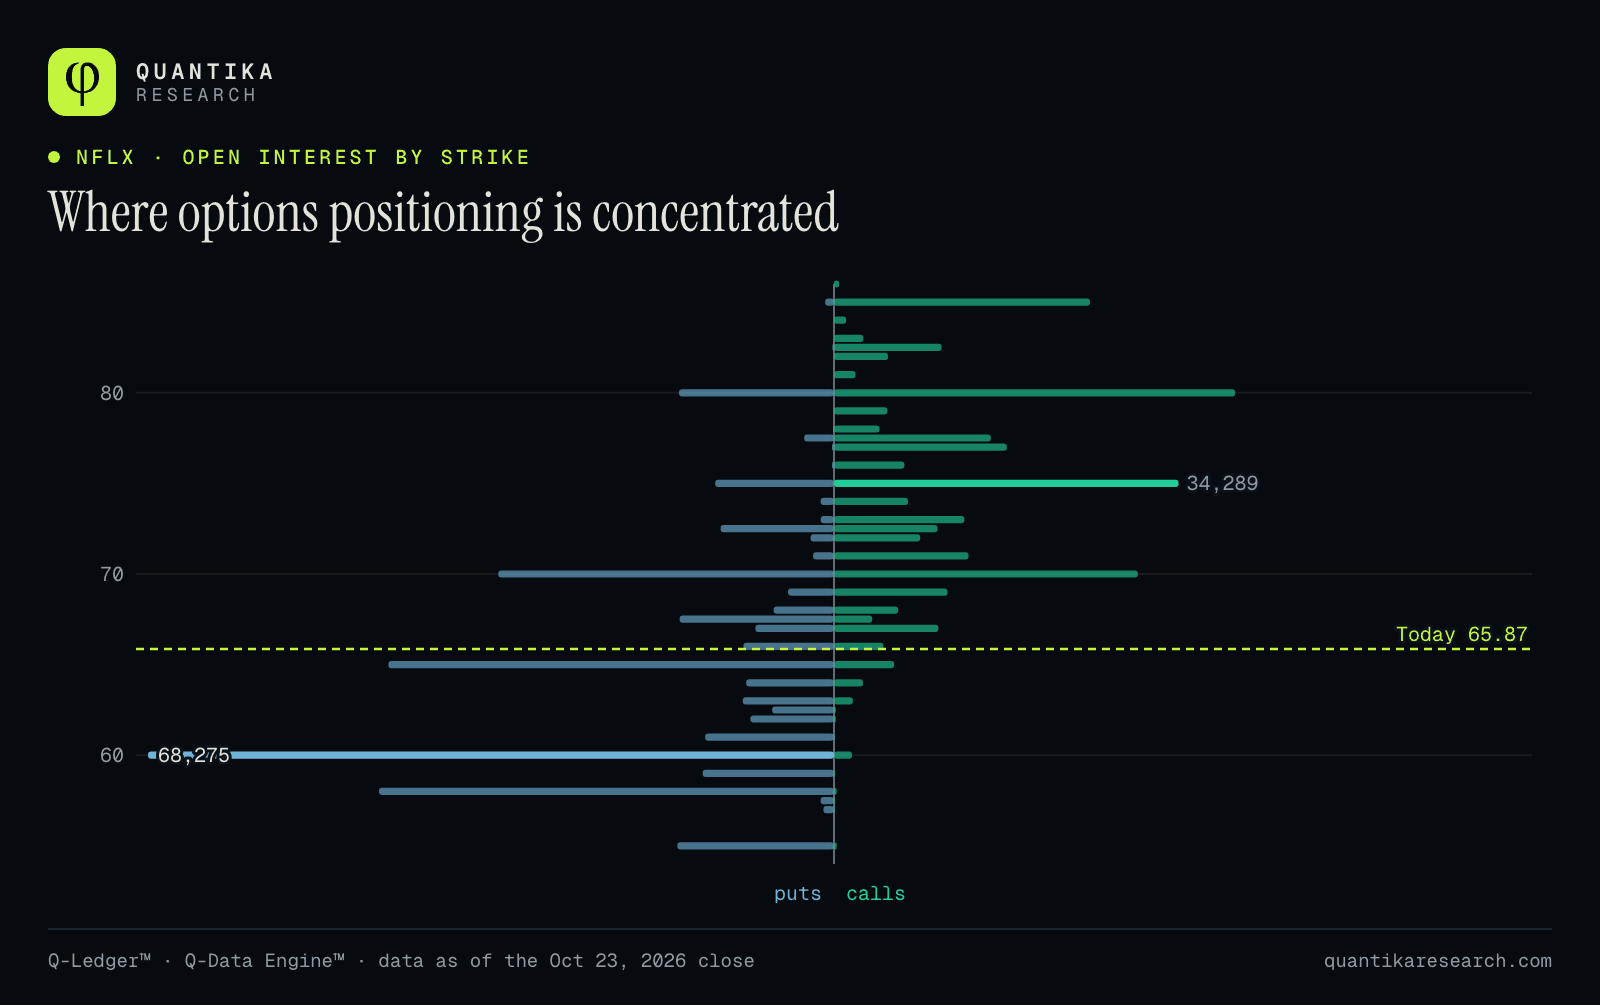
This week, expiring October 30, there are 11,917 puts at $65 and 11,100 calls at $70. Implied volatility (31.1%) is below realized (35.5%): options are not pricing panic. With that volatility, the expected range to November 27 (one standard deviation, ≈ 68% probability) runs from $59.7 to $72.0. An options wall shows where positioning is concentrated: it is not a forecast.
07Against its peers
Netflix, Disney and Warner Bros. Discovery no longer report subscriber counts†, so the comparison uses what can be measured: growth, margins and valuation, over each company’s last 12 reported months.
| Company | Price | Market cap ($ billion) | P/E | EV/EBITDA | Revenue 12 m | EBITDA margin | Free cash flow / cap. | Net debt / EBITDA | Price 12 m |
|---|---|---|---|---|---|---|---|---|---|
| Netflix | $65.86 | 274 | 18.8x (≈ 22x) | 17.6x | +14.7% | 32.1% | 4.1% (≈ 3.3%) | 0.4x | −40.9% |
| Amazon | $247.99 | 2,675 | 19.7x | 16.2x | +15.8% | 21.8% | −0.4% | 0.4x | +12.2% |
| Disney | $112.50 | 194 | 23.1x | 9.6x | +4.6% | 24.0% | 4.3% | 1.6x | −0.5% |
| Roku | $158.58 | 24 | 65.8x | 62.1x | +18.5% | 6.6% | 3.0% | −5.8x | +61.4% |
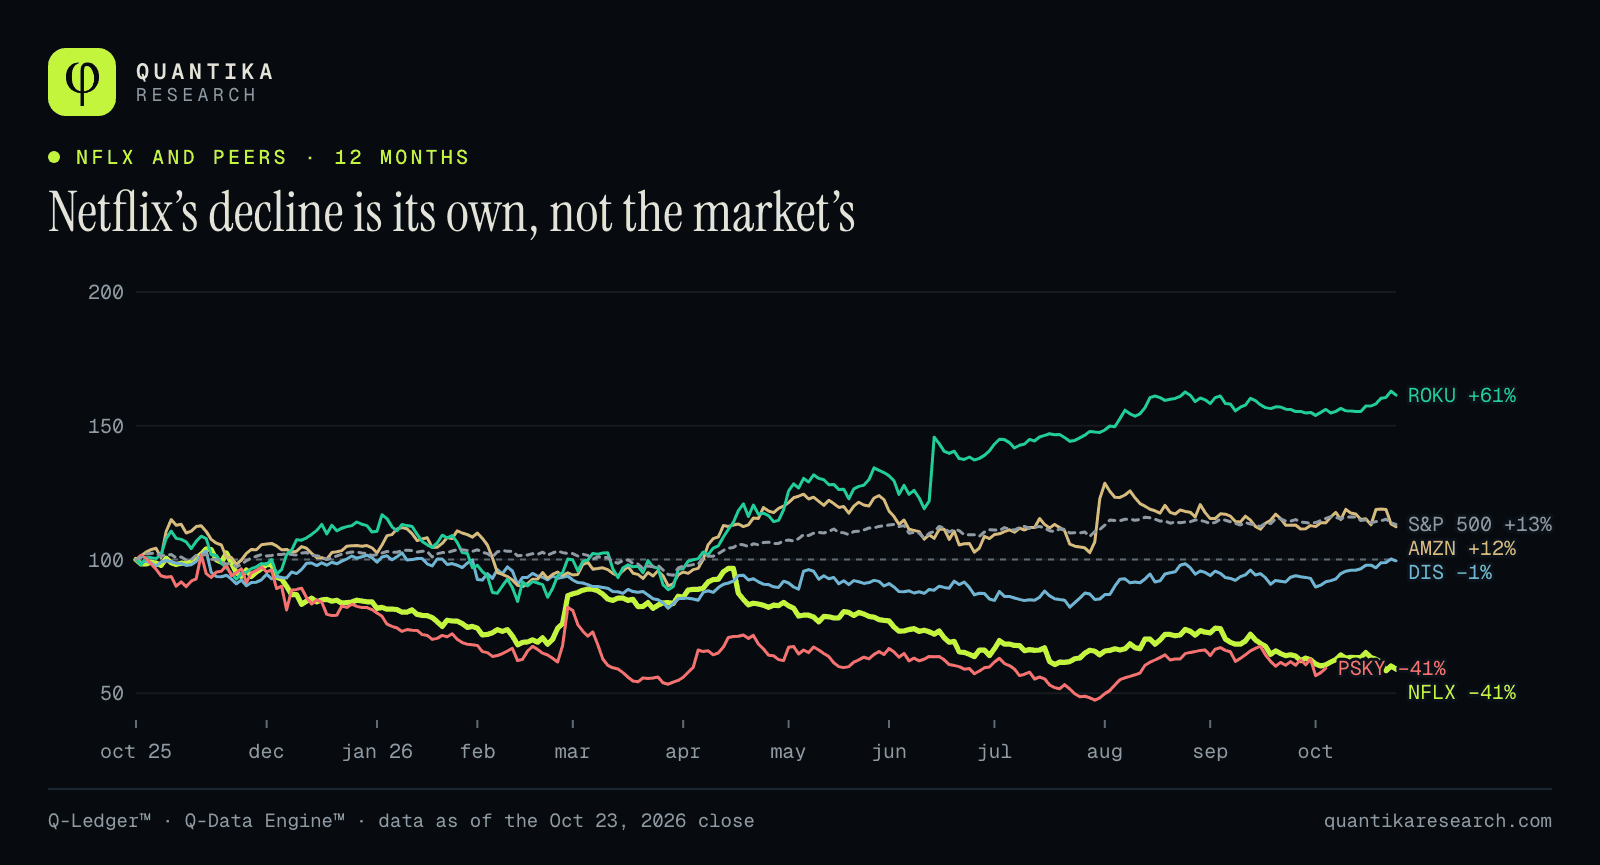
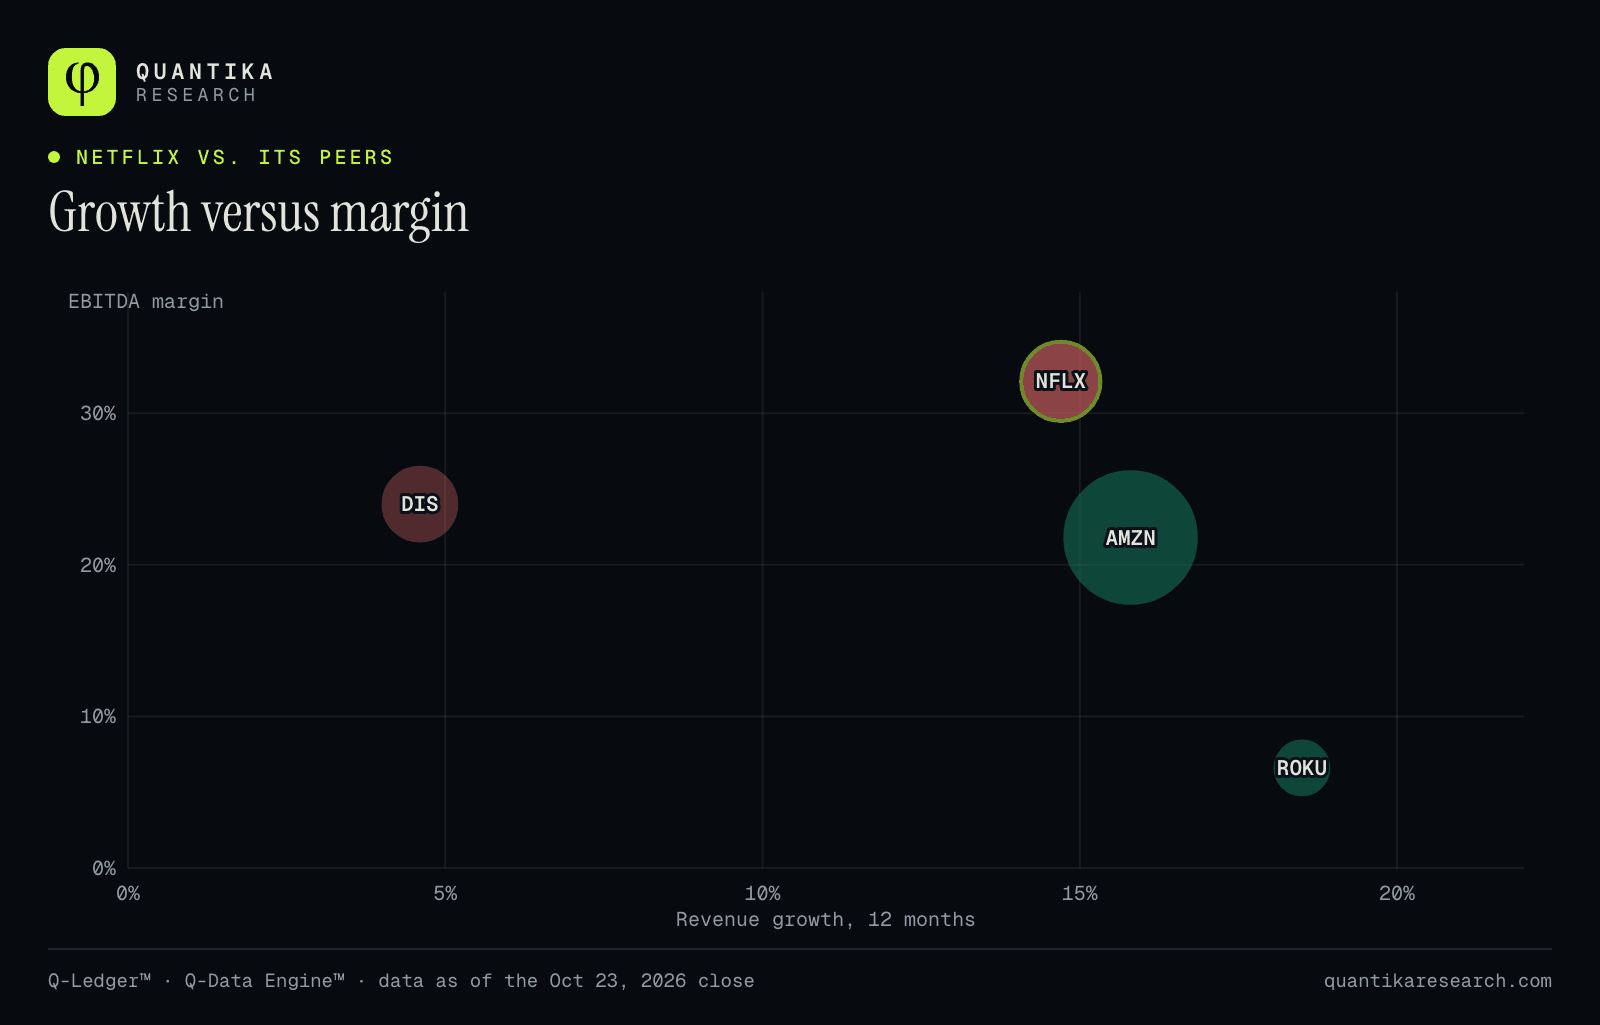
Against Disney, Netflix grows 3.2 times faster (14.7% versus 4.6%), with a better EBITDA margin (32% versus 24%) and almost the same P/E (22x versus 23x). Disney is cheaper on EBITDA (9.6x versus 17.6x), but it grows little and owes more (1.6x net debt over EBITDA). Roku grows faster (18.5%) with an EBITDA margin of 6.6% and multiples of 62x EBITDA and 66x earnings: its price already discounts a lot (+61% over 12 months).
Paramount Skydance fell 41% over 12 months. According to its Q2 26 report, it has 81.6 million Paramount+ subscribers, quarterly revenue of $6.9 billion, net income of $41 million and 2026 adjusted EBITDA guidance of $3.8 to $3.9 billion†. It seeks to absorb Warner Bros. Discovery, which trades at $30.99, pinned to the $31 offer: it offers no valuation signal. The proposed merger, with regulatory review still open, would combine Paramount+ and HBO Max into a larger, heavily indebted competitor.
Prime Video (Amazon)†
Amazon does not break out Prime Video in its financial statements, so it cannot be valued separately from public data. Digital video revenue sits within “subscription services” (≈ $49.6 billion in 2025, +12%), which mixes the Prime membership with shipping, music and books. Its video and music content spend was ≈ $22.4 billion in 2025 (+10%), including music and sports rights, equal to 3.1% of its sales; analysts estimate ≈ $2.1 billion of Prime Video advertising in 2026. All of Amazon trades at 19.7x earnings and 16.2x EBITDA; Netflix, which only does streaming, at ≈ 22x and 17.6x.
08What to follow at Netflix and its peers
What Netflix has already published sets a list of figures worth watching when the others report. They are not predictions: they are the questions Netflix’s accounts leave open for companies that compete for the same audience and the same advertising.
| What to watch | What Netflix already showed | Where to see it in the peers |
|---|---|---|
| Revenue growth | Netflix: from 17.2% to 11.8% in a year; Q4 guidance ≈ 11.5% | Amazon (15.8% through June), Roku (18.5%) and Disney (4.6%) |
| Advertising | Netflix cut its 2026 target from ≈ $3,000 to ≈ $2,700 million on a slower rollout | Roku platform revenue and Amazon advertising (includes Prime Video) |
| Margin | Netflix: 34.6% in Q3 and 26.0% guided for Q4, with ≈ 1.2 points from a ≈ 6% headcount cut | Starting EBITDA margin: Amazon 21.8%, Disney 24.0%, Roku 6.6% |
| Content | Netflix invested $1.17 in cash for every dollar of amortization over nine months | Amazon: video and music spend ≈ $22.4 billion in 2025†; Disney: content spend in its report |
| Capital return | Buybacks of 4.7% of market value in 12 months, more than recurring free cash flow | Free cash flow / cap.: Disney 4.3%, Roku 3.0%, Amazon −0.4% |
| Dates | Netflix: Q4 report in January 2027 | Amazon and Roku: October 29; Disney: November 12 (estimated dates) |
What these data do not answer: what the stock price will do over the coming weeks or months; whether growth will keep slowing or stabilize (guidance covers one quarter); how the market will react to the Q4 report (five out of five times it was lower, but that describes the past); whether the Paramount–Warner Bros. Discovery merger goes through; and what is suitable for each reader, which depends on their situation, time horizon and risk tolerance.
Sources
- Annual and quarterly reports of Netflix, Inc. and the Q3 2025 and Q3 2026 earnings releasesSource of the income, cash flow, balance sheet, buyback and guidance figures. Figures in millions of dollars, rounded.
- Annual and quarterly reports of Amazon, Disney and RokuLast 12 reported months of each: Amazon and Roku through June 2026, Disney through June 2026 (its fiscal year ends in September).
- Q-Ledger™, Q-Pulse™, Q-Forensics™ and Q-Data Engine™ from Quantika ResearchExtraction of the figures from those reports, quality indicators, and prices, volume and options positioning as of the October 23, 2026 close.
- † Third-party figuresParamount Skydance’s Q2 26 report and its merger filing with Warner Bros. Discovery ($2.8 billion fee, $31 per share offer); Amazon’s 2025 annual report; analyst estimates of Prime Video advertising; the earnings-per-share consensus cited by the financial press; and the decision by Netflix, Disney and Warner Bros. Discovery to stop reporting subscribers.
Method note
Figures in millions of dollars, rounded; because of rounding, a sum may differ by a million. The ≈ symbol marks our own estimates: the ≈ $2.8 billion one-off gain is removed at a 21% tax rate (≈ $2.2 billion after taxes) and the “recurring” P/E uses ≈ 4,200 million average shares. The P/E of a year ago uses the earnings reported at the time. Prices and volume are as of the October 23, 2026 close. An options wall shows where positioning is concentrated: it is not a forecast. Quantika Research and its author may hold positions in the securities mentioned. Nothing in this report is an investment recommendation.