Four companies were in that room. Here is what their accounts say.
On August 19, 2026, executives from several exchanges and trading platforms met at the White House to push the CLARITY Act. Four of those companies are publicly listed and file their accounts. This report does not comment on the meeting: it reads the financial statements, line by line.
A White House meeting produces headlines for two days. The financial statements of the people in the room span five years and can be checked one by one. This report does the second: it takes the four listed companies that attended, opens their accounts and describes what they say. Not what their shares will do, which is a different question and one this report does not answer.
The room

On August 19, 2026, at the Eisenhower Executive Office Building on the White House complex, the president urged Congress to pass the CLARITY Act: the framework that would finally settle whether a digital asset is a security or a commodity. The bill cleared the House of Representatives in 2025 and remains stalled in the Senate.
In the room were executives from exchanges and trading platforms, alongside the chairs of the SEC and the CFTC. Accounts of the event do not fully agree on the attendee list. This report focuses on four of the listed companies mentioned consistently and that file audited accounts: Coinbase, Robinhood, Nasdaq and Intercontinental Exchange, owner of the New York Stock Exchange.
The same narration, audio only. It is not a transcript of the text: it was written for the ear, and the written report goes further in several sections.
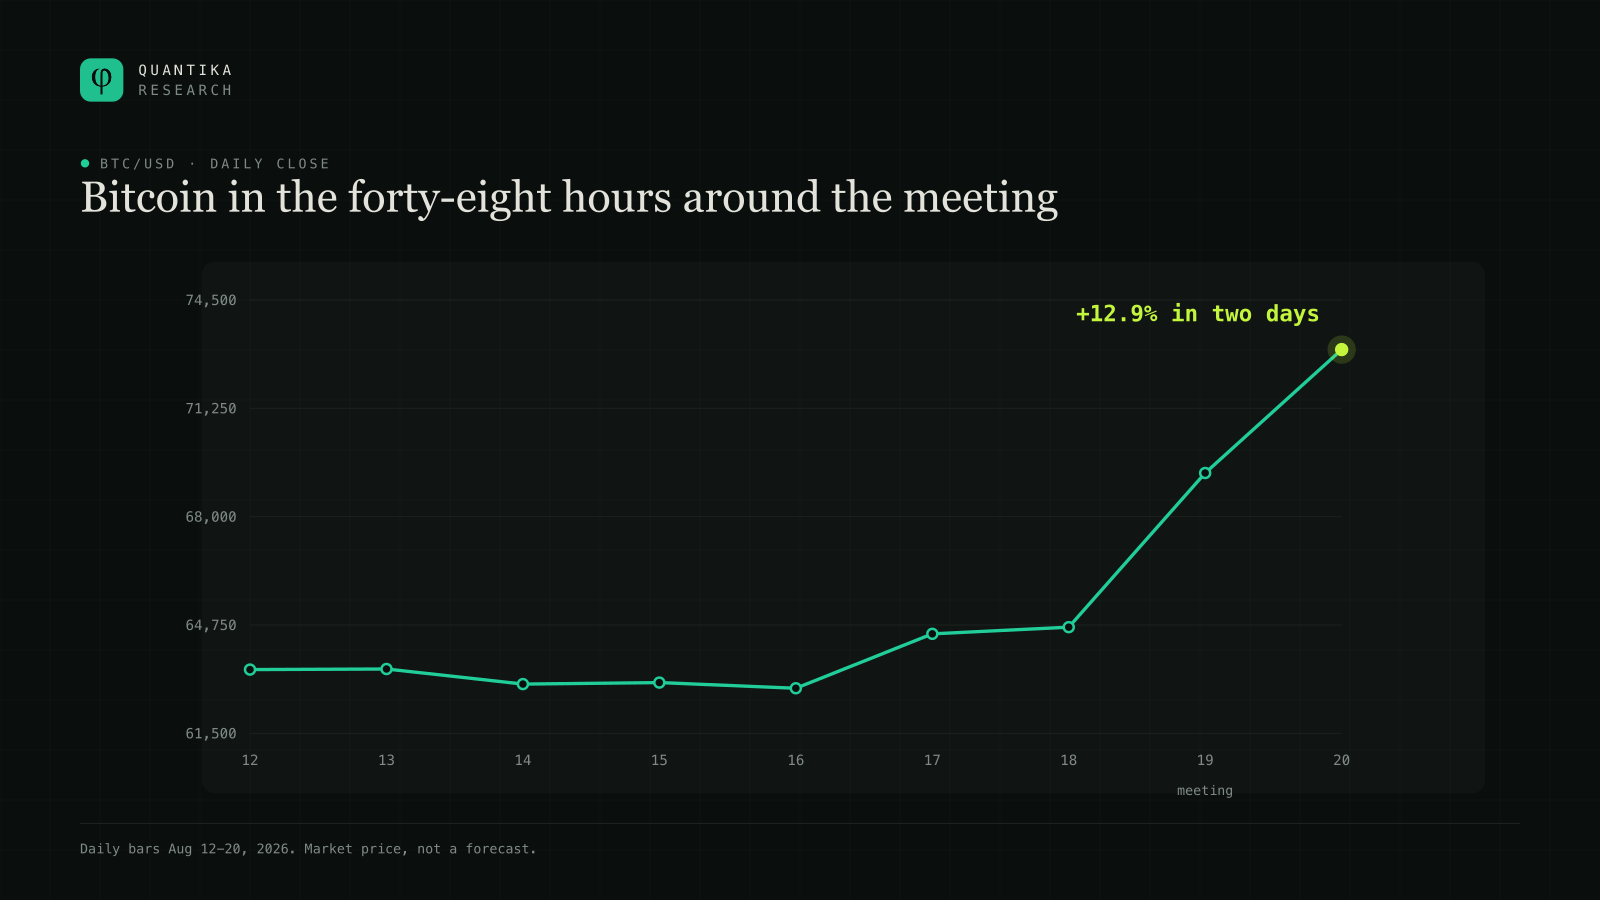
That price move is the context, not the content. What follows does not comment on the meeting or the bill: it describes what these companies reported in their annual filings.
Ranking by revenue, and why it says so little
 Intercontinental Exchange
 Nasdaq
 Coinbase
 Robinhood
Ranked by their latest fiscal year's revenue, the four line up like this.
| Company | Revenue | Net income | Net margin |
|---|---|---|---|
| Intercontinental Exchange | 12,640 | 3,315 | 26.2% |
| Nasdaq | 8,262 | 1,788 | 21.6% |
| Coinbase | 7,181 | 1,260 | 17.6% |
| Robinhood | 4,473 | 1,883 | 42.1% |
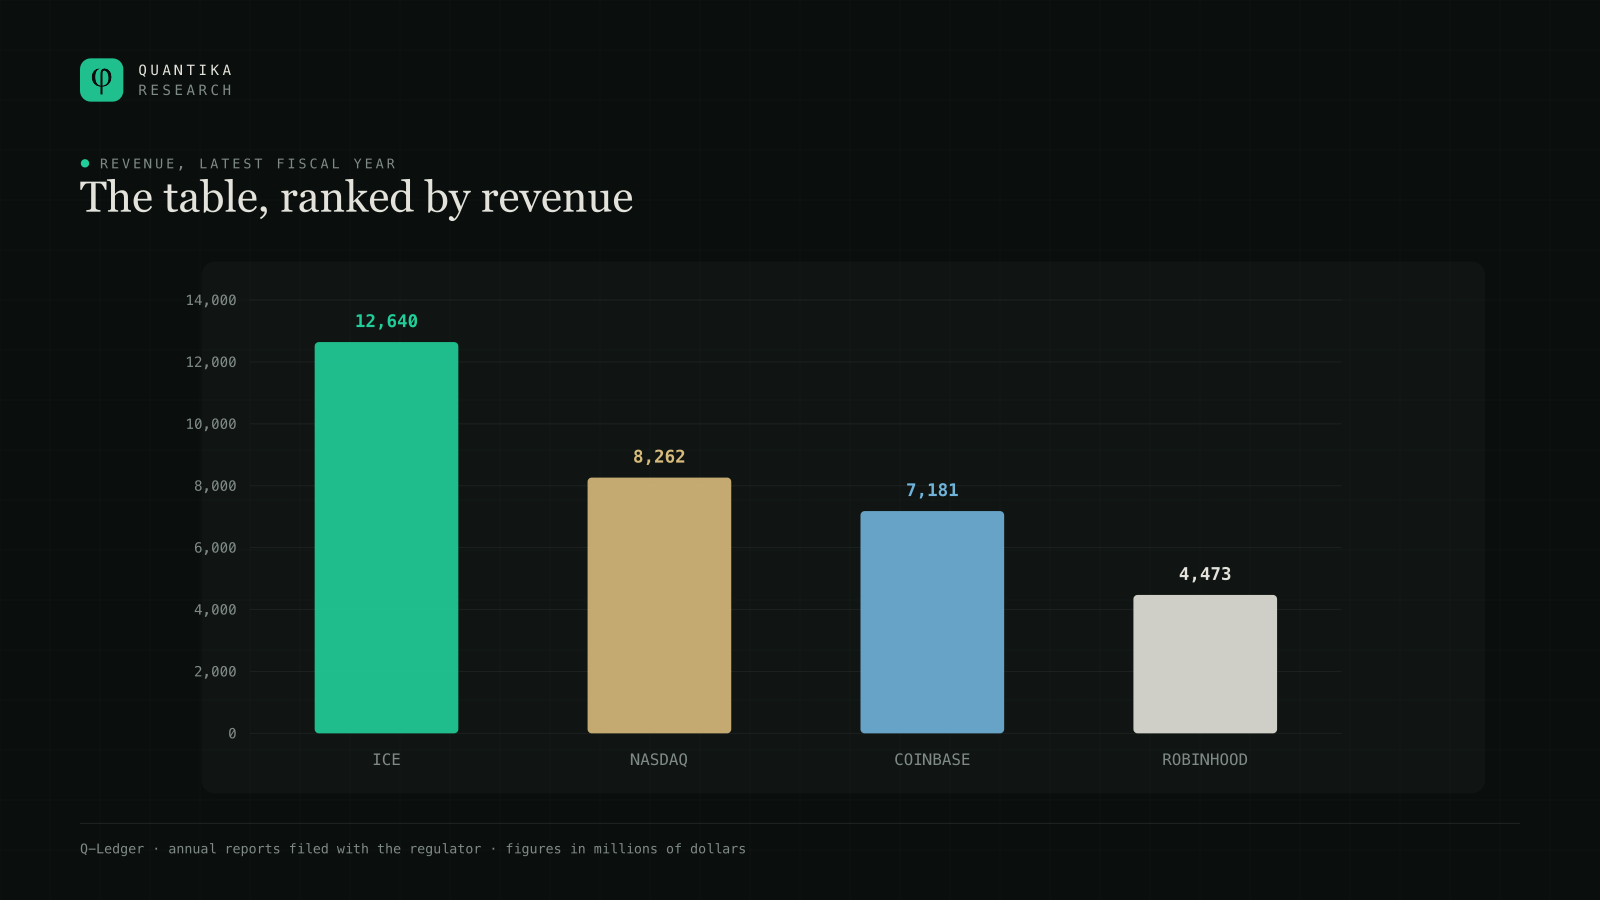
There is already something odd in that table: the company with the least revenue of the four is the one that keeps the most. We will come back to it at the end, because it is the most useful finding in this report.
A revenue figure on its own says how much came in. It does not say how much stayed, where it came from, or whether it repeats next year. The rest of this report is about opening up those four numbers.
Coinbase: four years and still not back
Coinbase booked $7,839 million in 2021. The following year, $3,194 million. A 59% fall in twelve months.
Four fiscal years have passed since. In 2025 it booked $7,181 million: still 8.4% below where it stood in 2021.
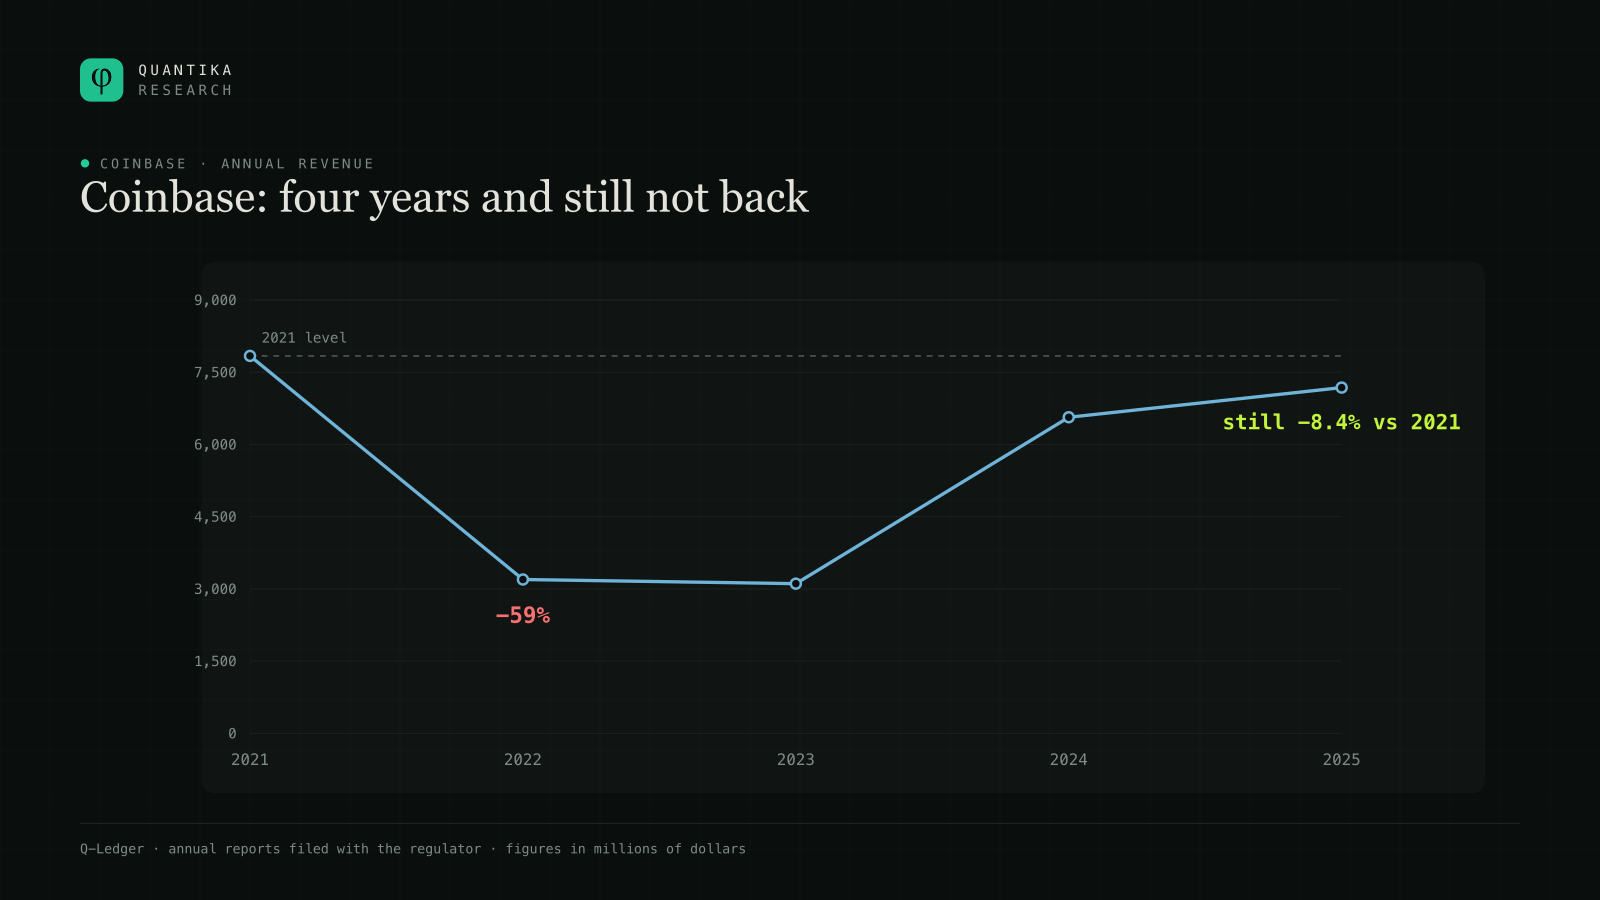
It is the shape of a business tied to a cycle: it rises sharply, falls sharply and takes time to come back. That describes what happened; it says nothing about what will happen.
Where Coinbase's margin went
The latest fiscal year is more interesting than the recovery, and it is the part any headline summary skips.
Coinbase's revenue rose by $617 million in 2025. Its operating expenses rose by $1,489 million. More than double.
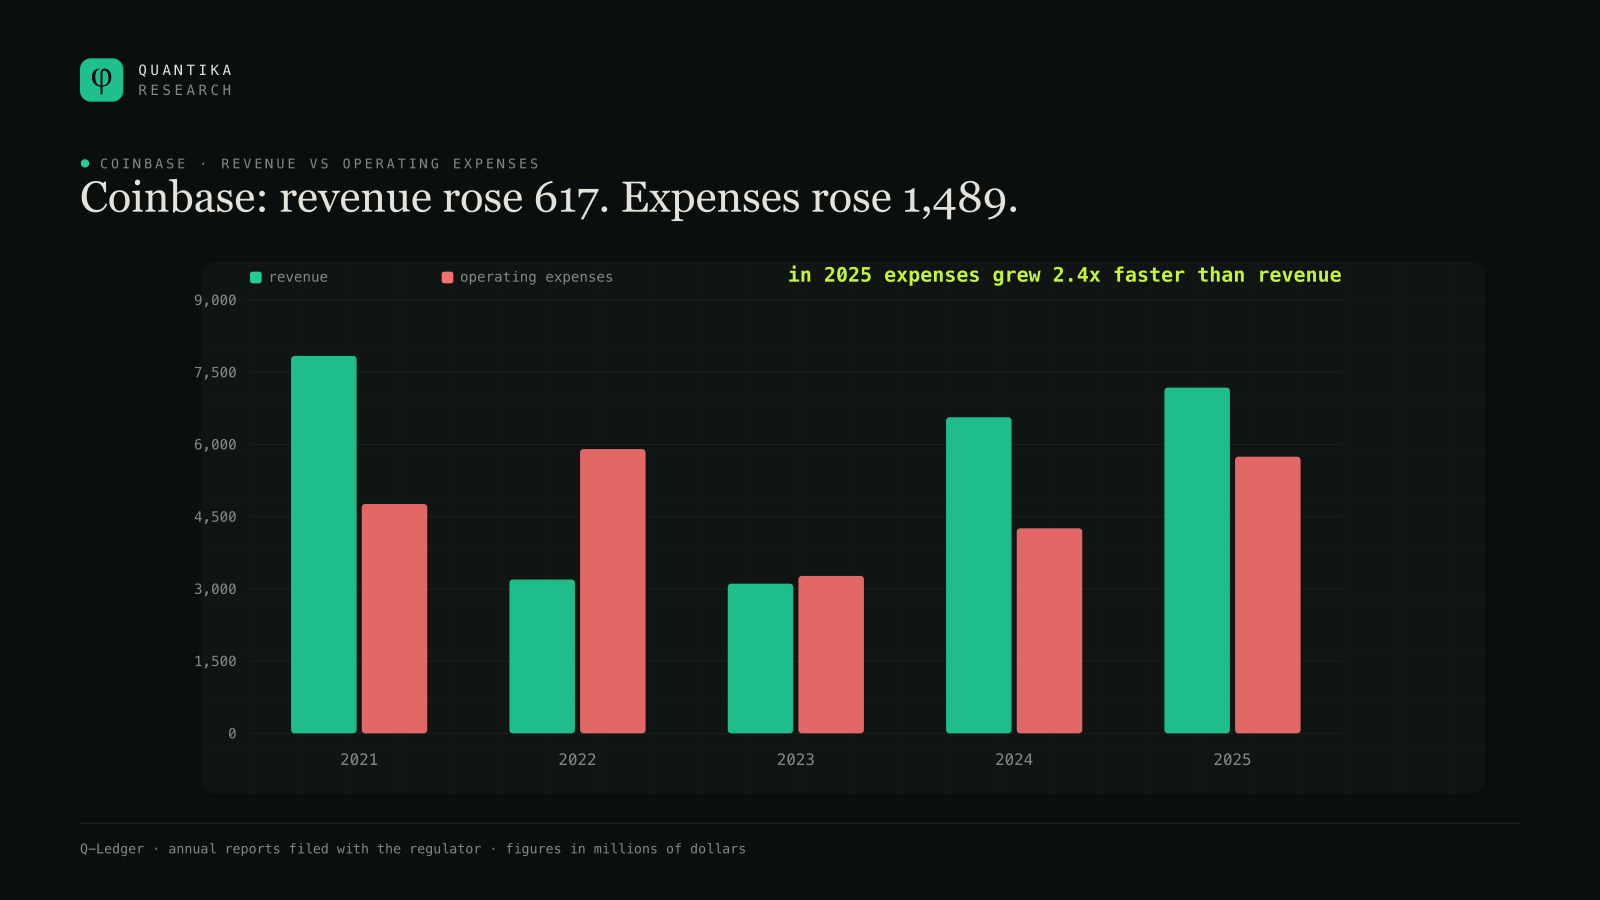
The arithmetic outcome is unavoidable: operating income fell from $2,307 million to $1,435 million, down 37.8%, with revenue rising. And net income ended up halved, down 51.1%.
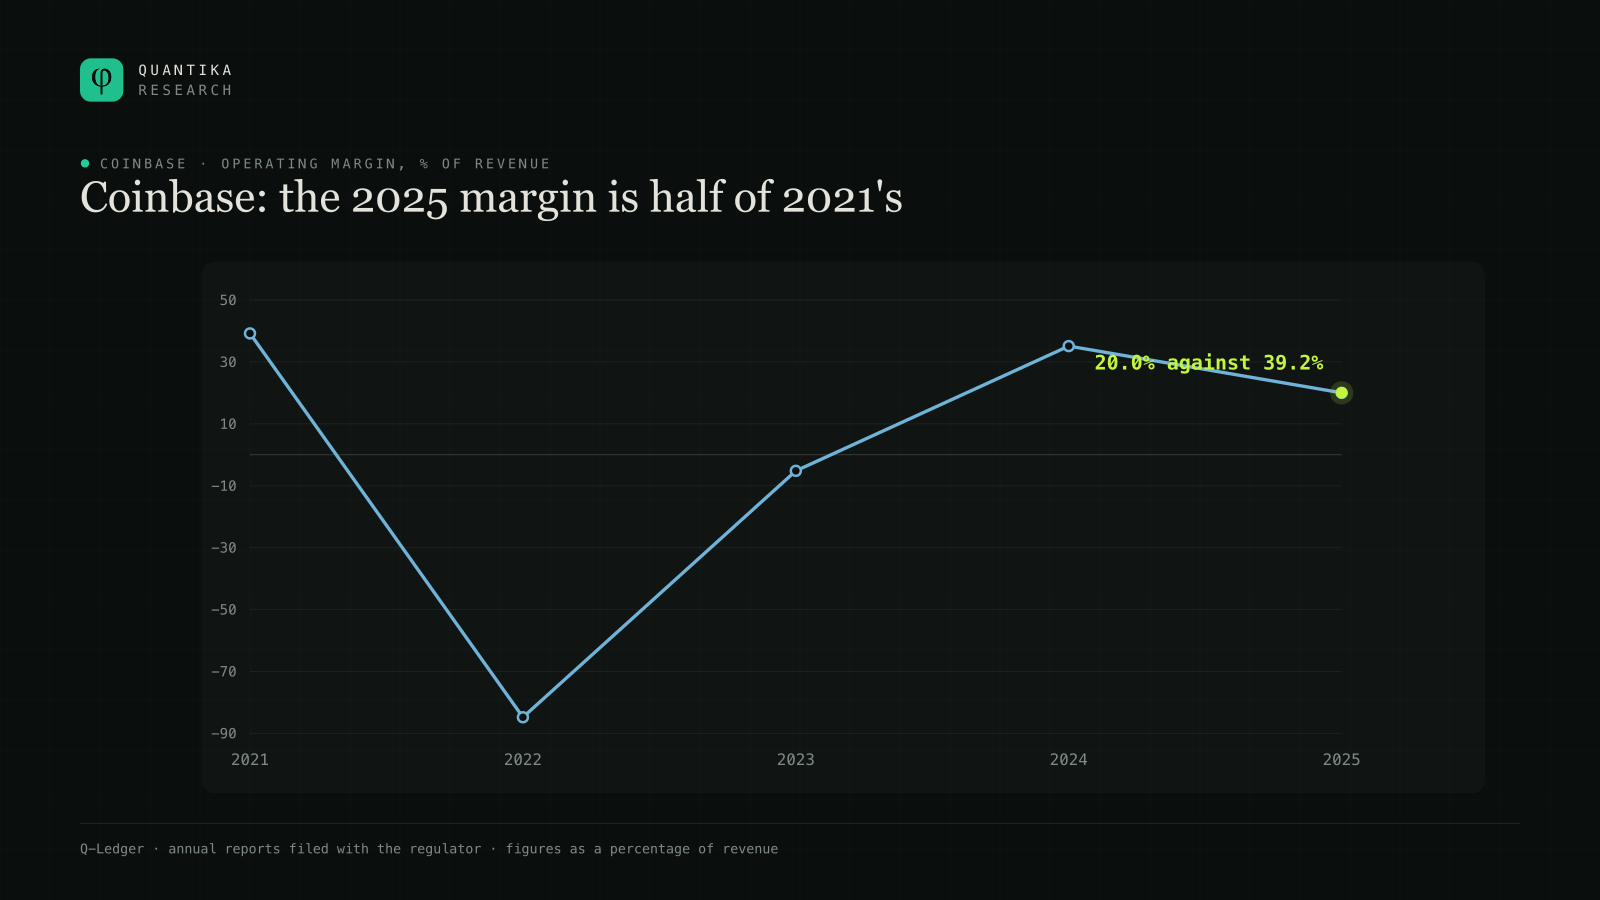
This is why you look at expenses and not only at the top line: two fiscal years can bring in practically the same revenue and leave results that differ by half.
Robinhood: 2.46x in four years
Robinhood went the other way. $1,815 million in 2021; $4,473 million in 2025. A factor of 2.46 in four years, and 51.6% in the last one alone.
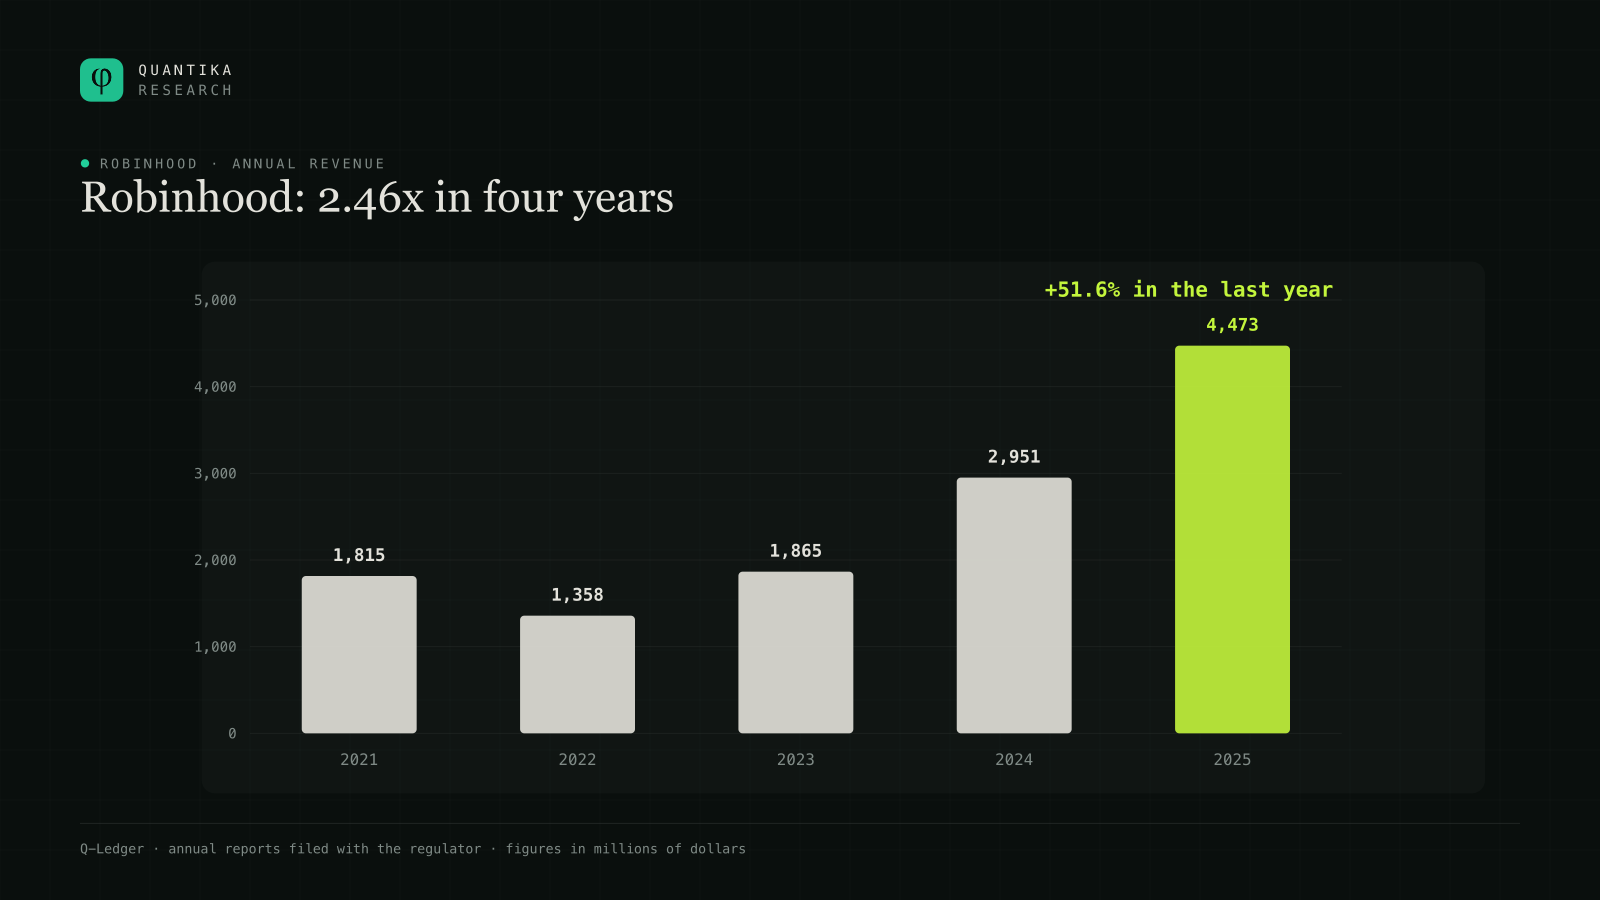
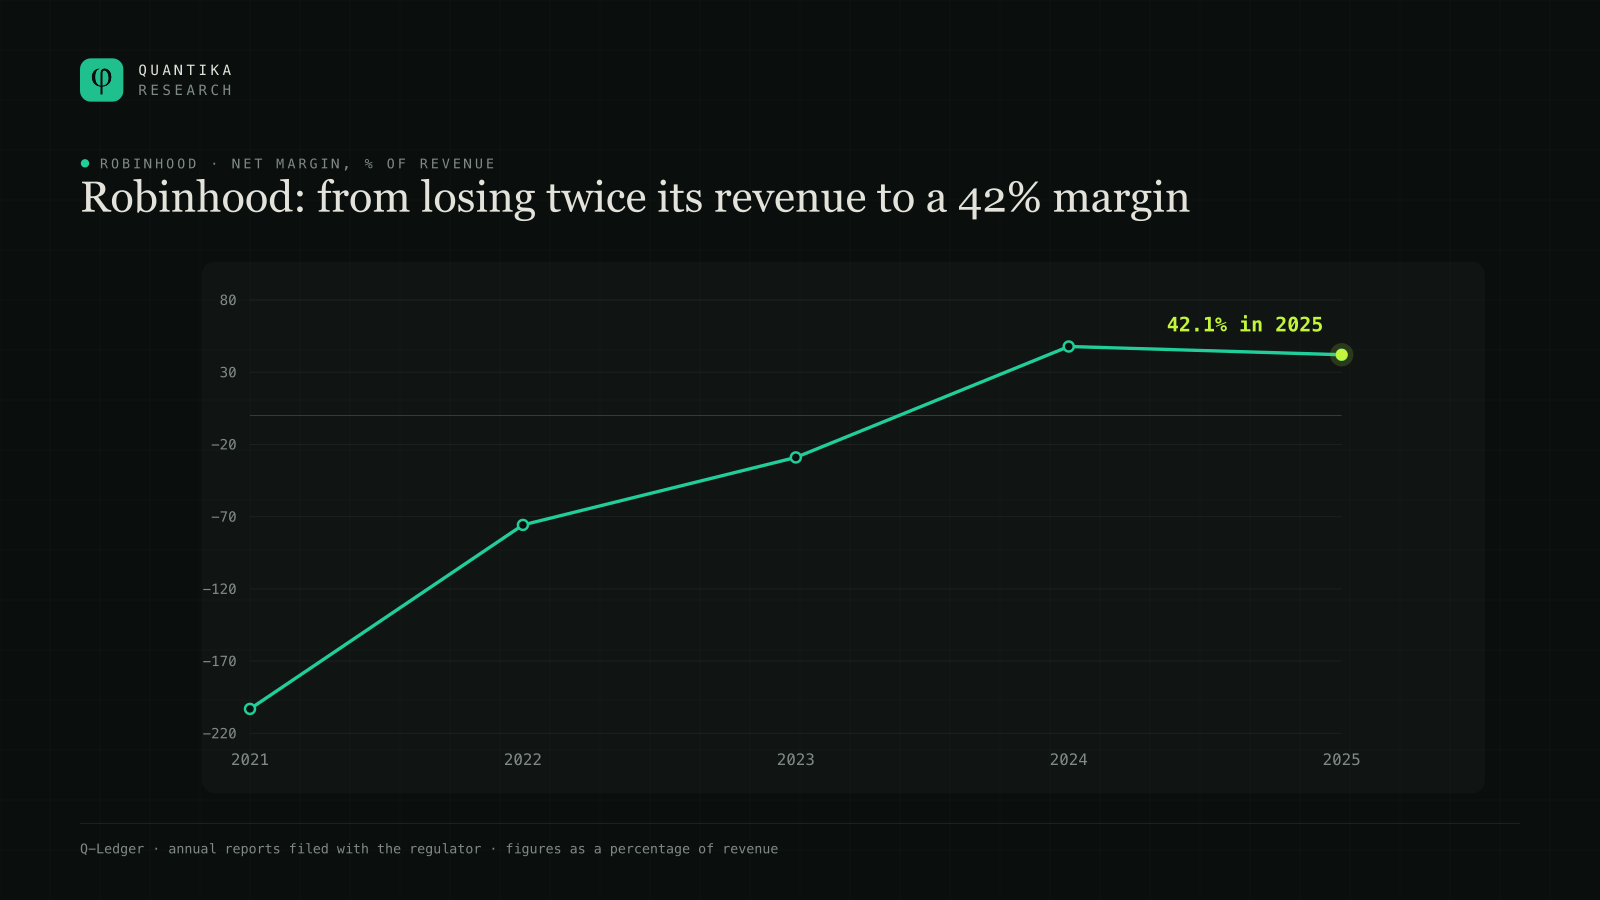
Its net margin for the latest year is 42.1%: of every $100 that came in, $42 stayed. It is the highest of the four companies in this report, by a wide gap.
Robinhood's tax asterisk
Before extrapolating that trajectory it is worth looking at fiscal 2024, because it contains an entry that does not repeat.
That year Robinhood reported $1,064 million in pre-tax income and $1,411 million in net income. The after-tax figure is larger than the before-tax one.
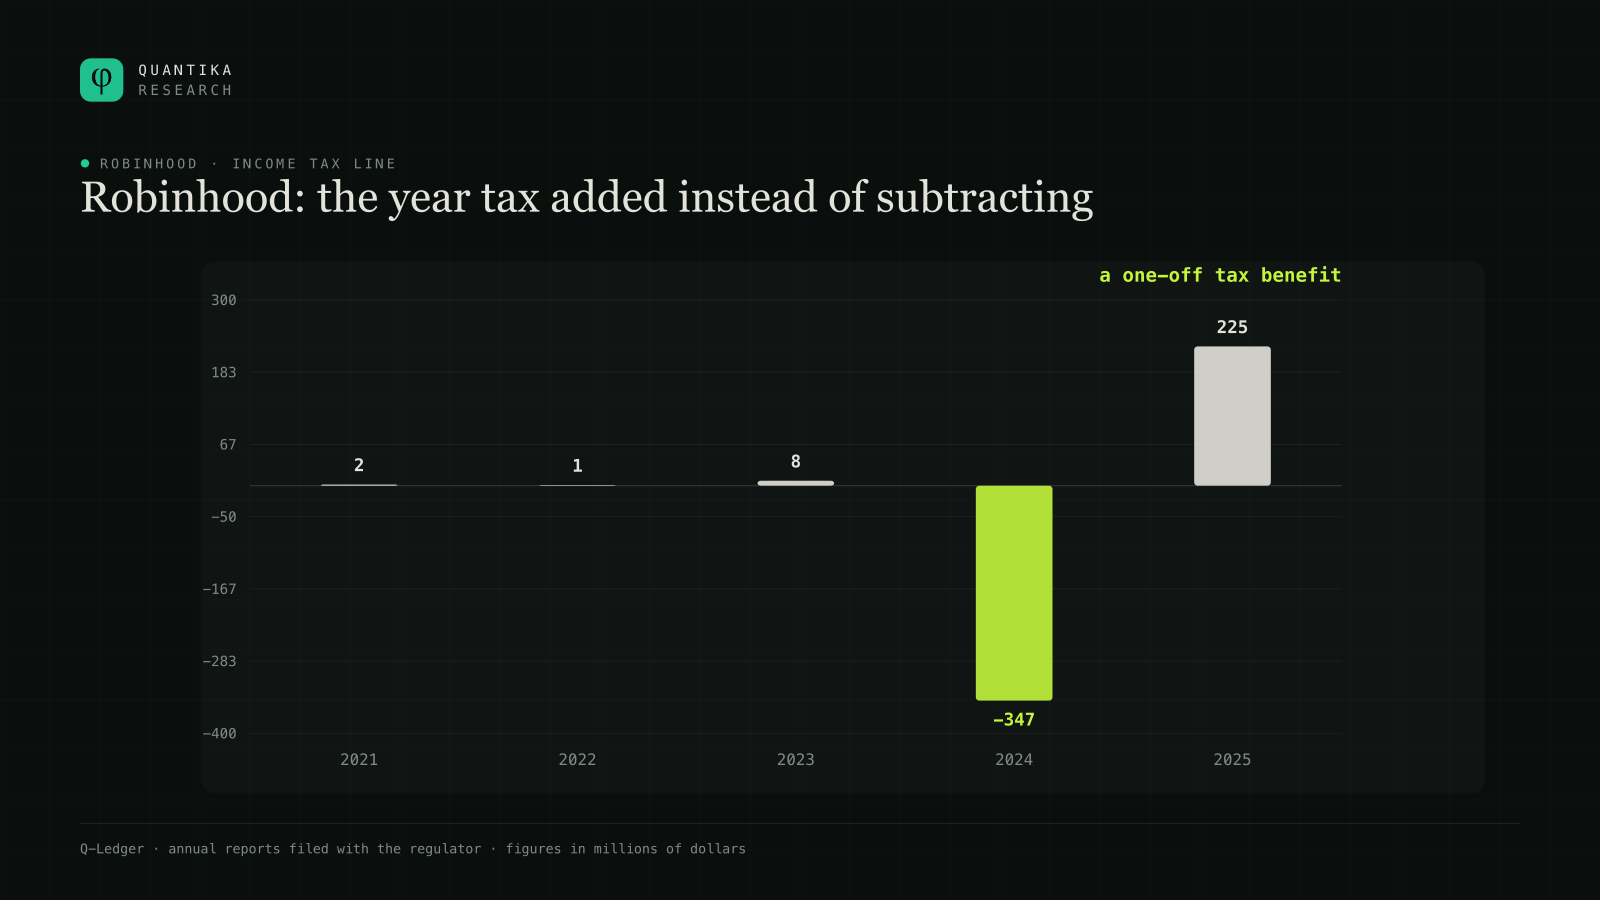
In 2025 the tax line subtracted $225 million again, which is its normal behaviour. That is why the 2024 net margin (47.8%) and the 2025 one (42.1%) are not directly comparable: the first carries something inside it that the second does not.
Nasdaq and ICE: the boring two
Nasdaq and Intercontinental Exchange do not appear in crypto headlines, and their accounts are the most monotonous of the four. That monotony is precisely the observation.
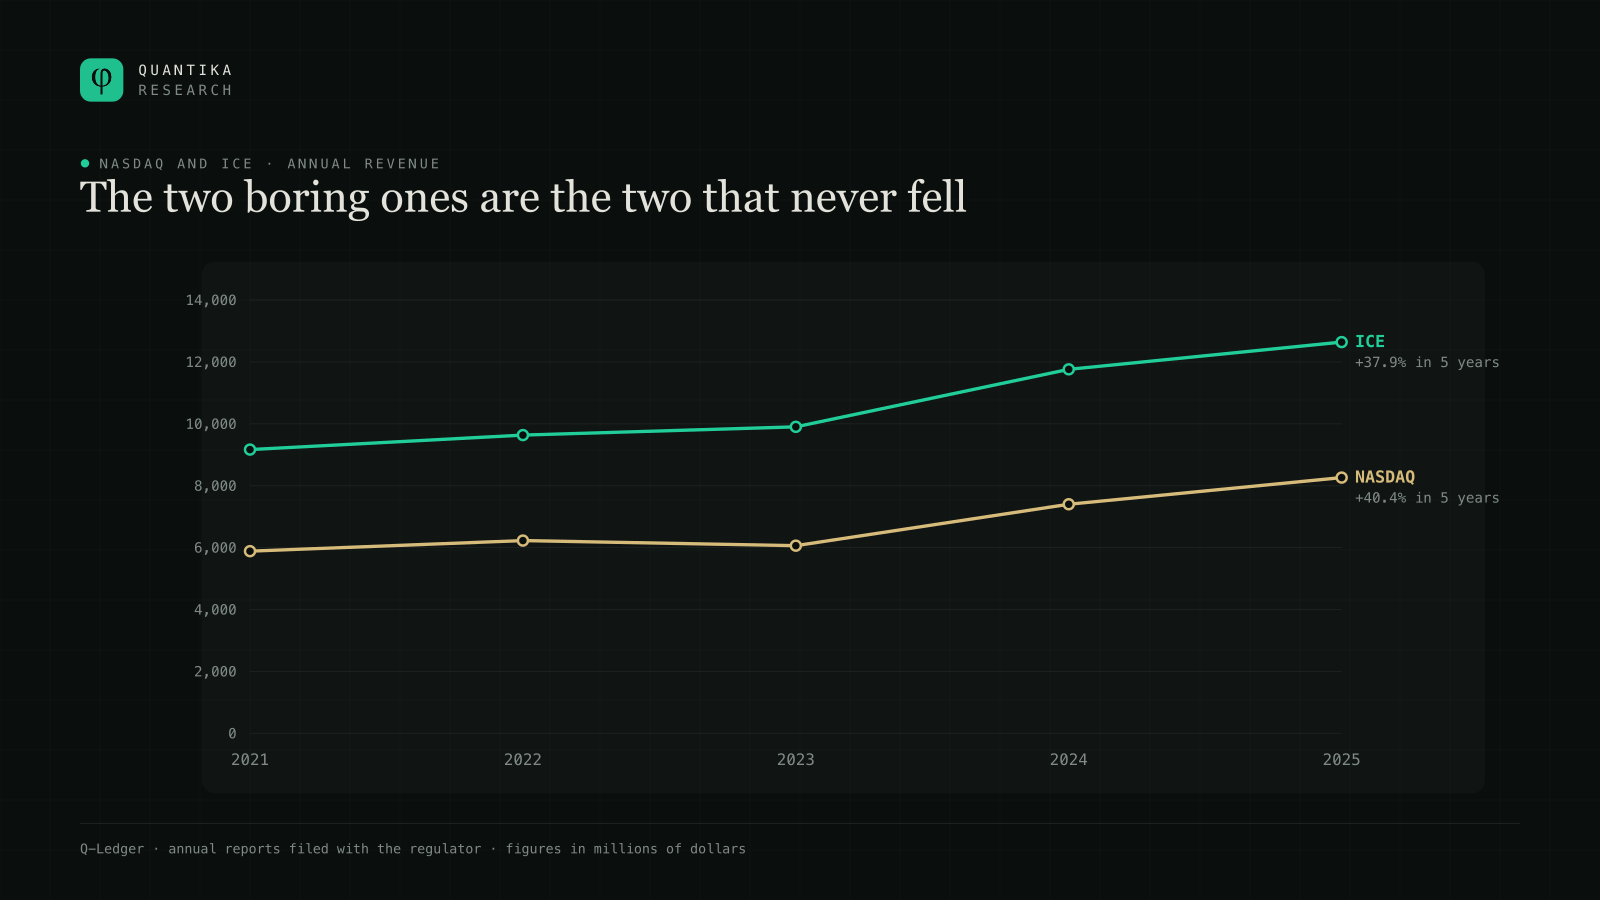
Nasdaq went from $5,886 million in 2021 to $8,262 million in 2025: up 40.4% over five years, without a single sharp down year. ICE went from $9,168 million to $12,640 million: up 37.9%, with the same shape.
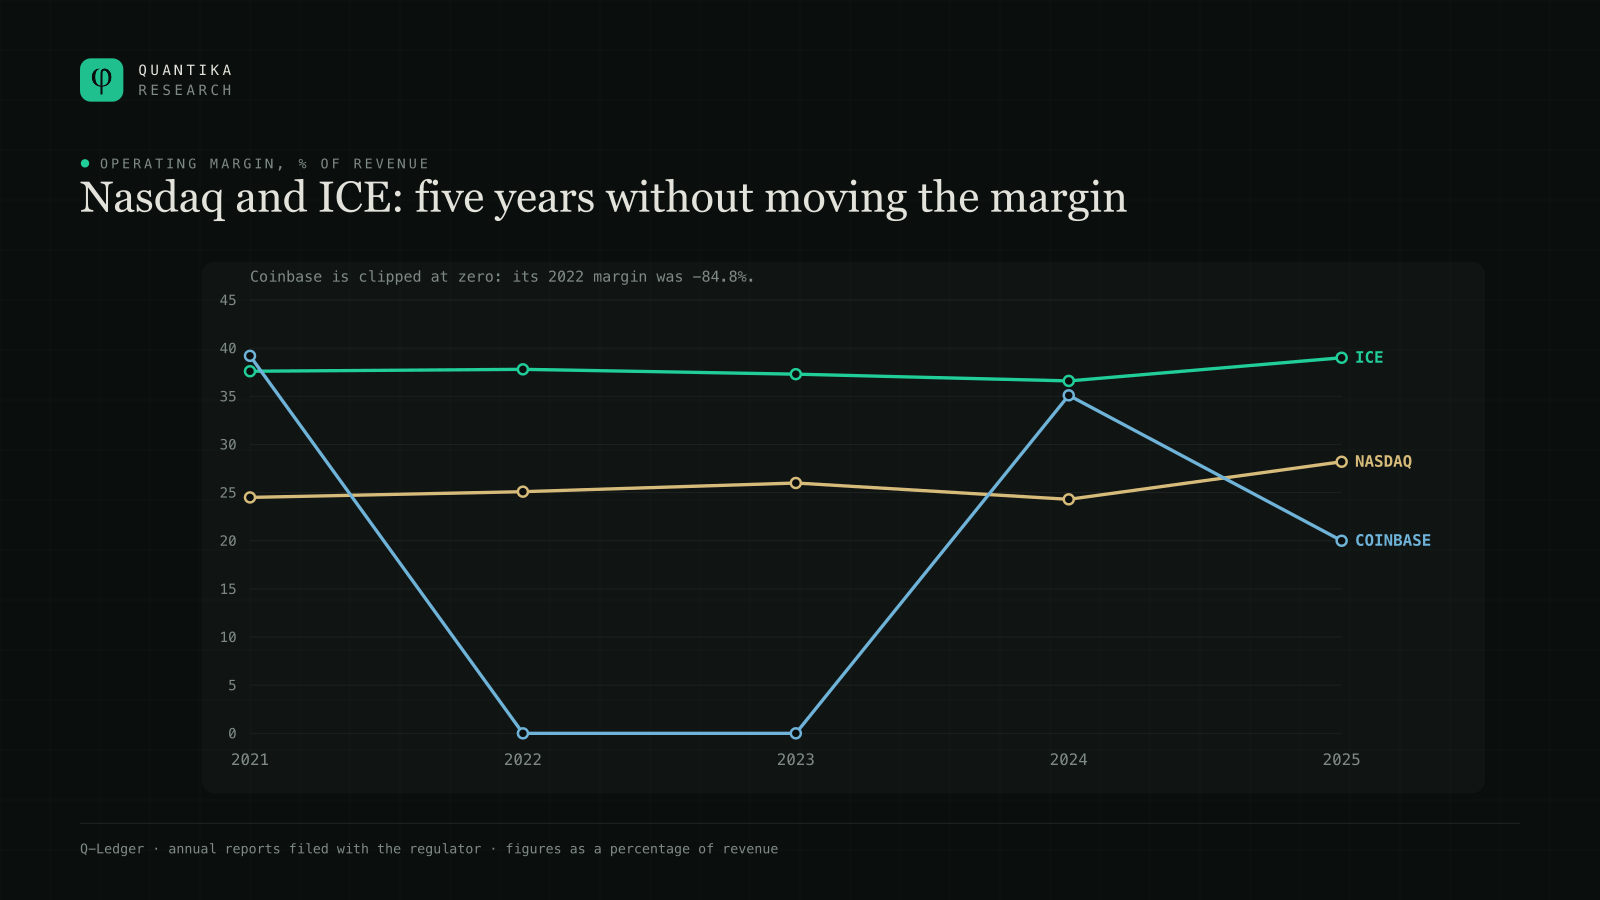
The margins tell the same story with even more precision. ICE's operating margin moved between 36.6% and 39.0% across five years. Nasdaq's, between 24.3% and 28.2%. Over the same period Coinbase's went from 39.2% to minus 84.8% and back to 20.0%.
An organized market charges for things being traded, cleared and settled. That happens whether the price of what is traded rises or falls, and in nervous periods it happens more.
The year ICE looks like it collapsed and did not
Even with that regularity, ICE has one fiscal year that looks at first glance like a disaster. In 2021 it reported $5,698 million in pre-tax income. In 2022, $1,808 million. A 68% fall.
That same year its revenue rose.
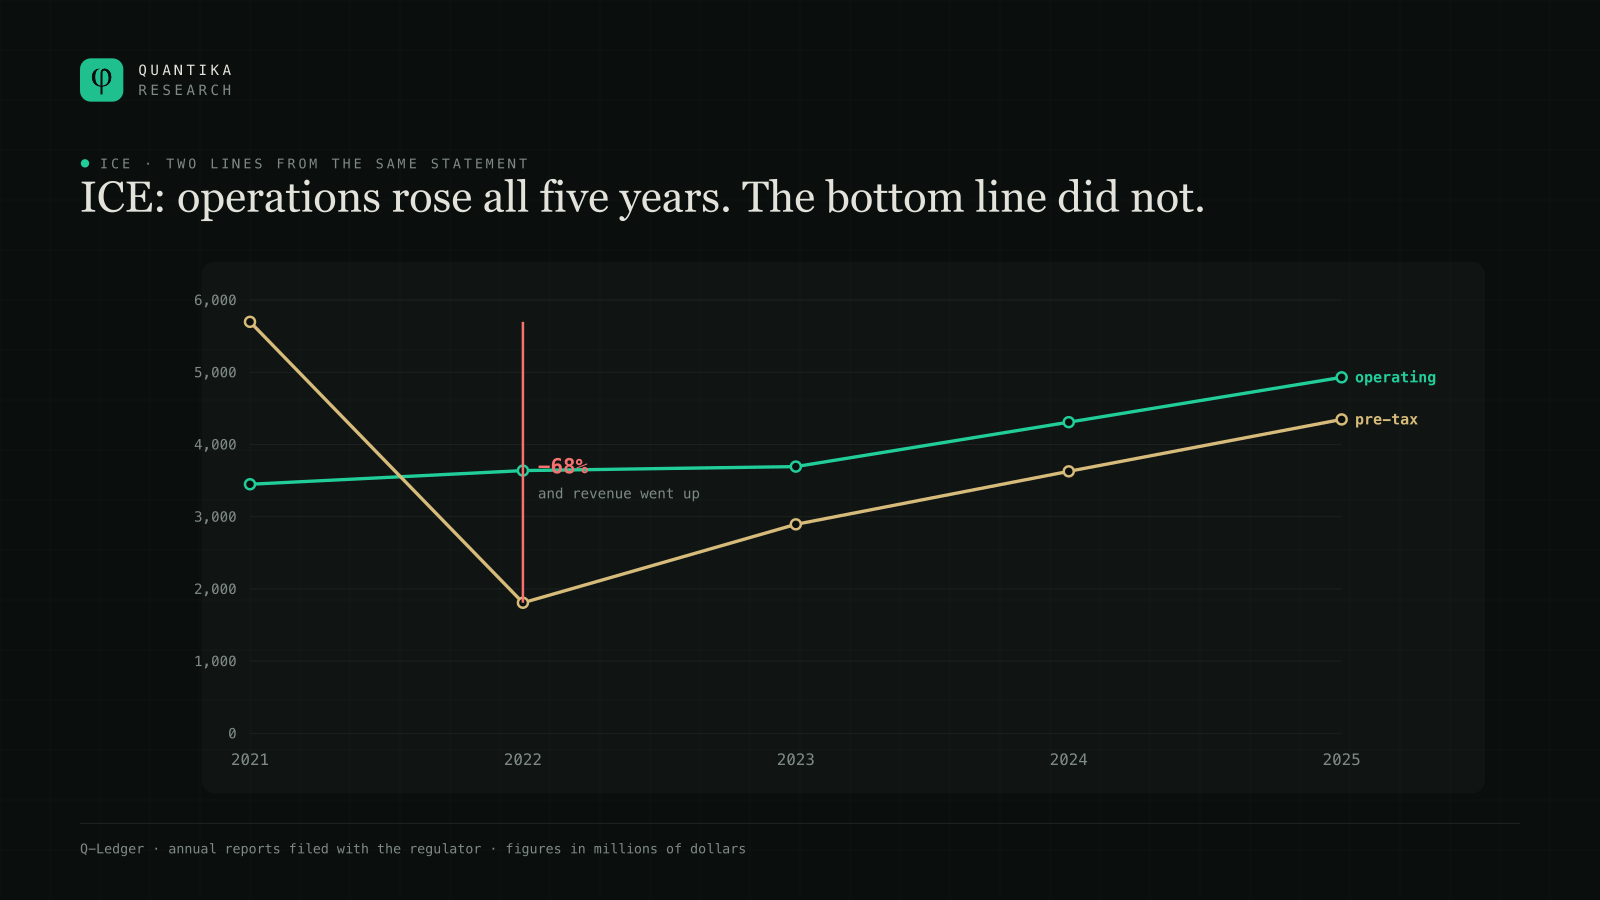
The difference between the two lines sits outside operations. Other non-operating income went from plus $2,671 million to minus $1,322 million, and the result from its stakes in other companies went from plus $34 million to minus $1,340 million.
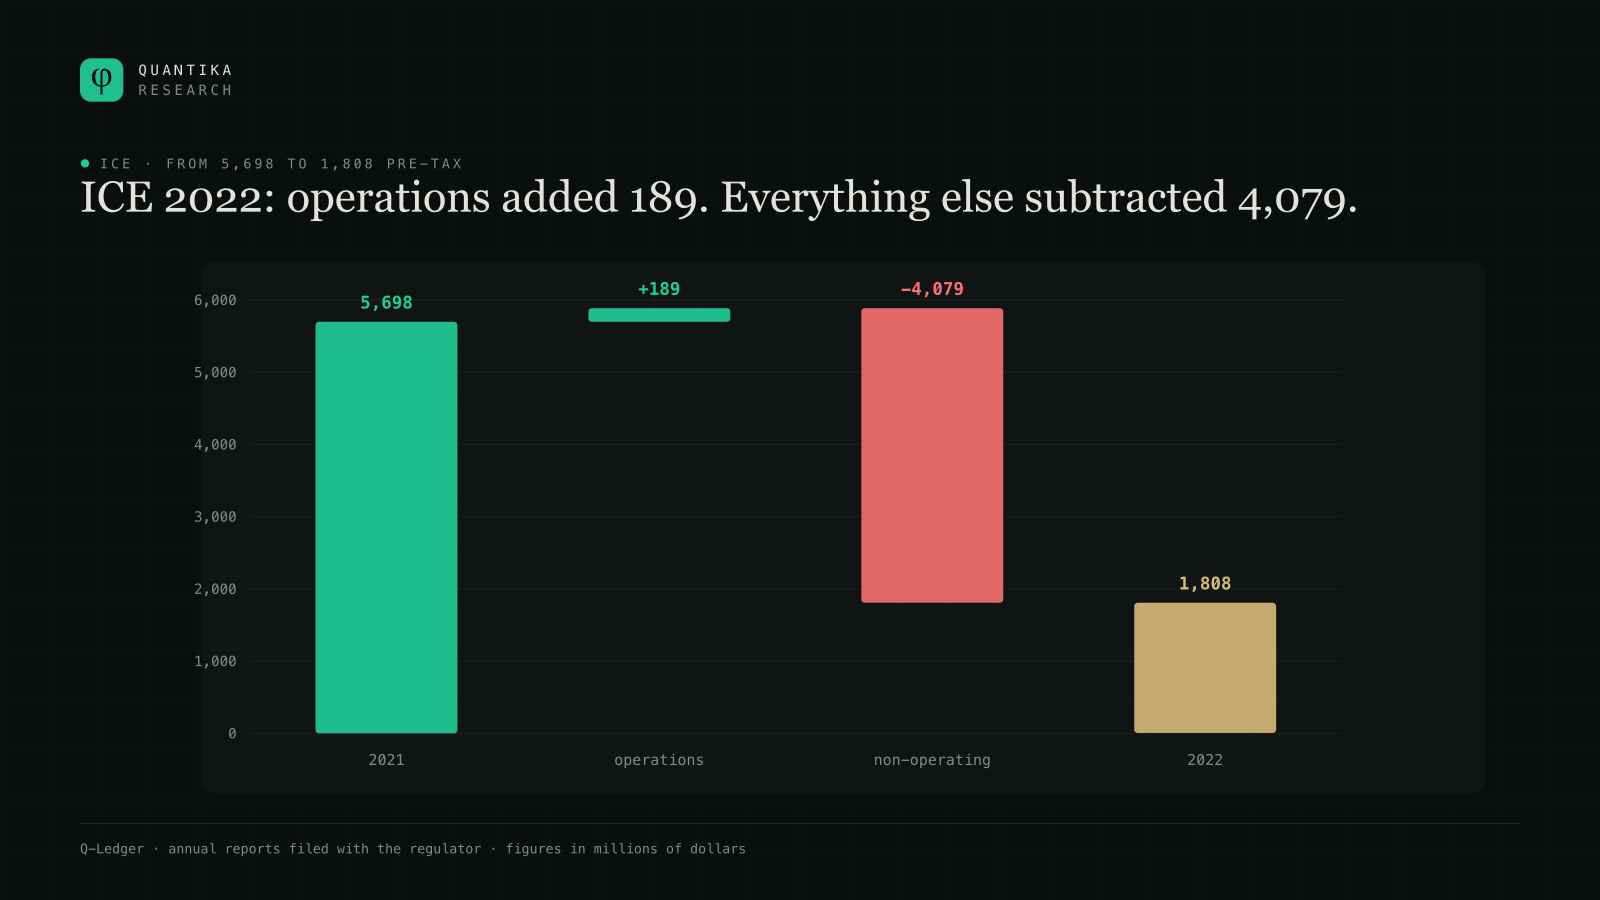
This is why the order in which you read the lines of an income statement matters. Stopping at the bottom line would have led to a conclusion about ICE's business that the business itself contradicts.
Ranking by margin nearly inverts ranking by revenue
Back to the oddity in the first table, which now explains itself.
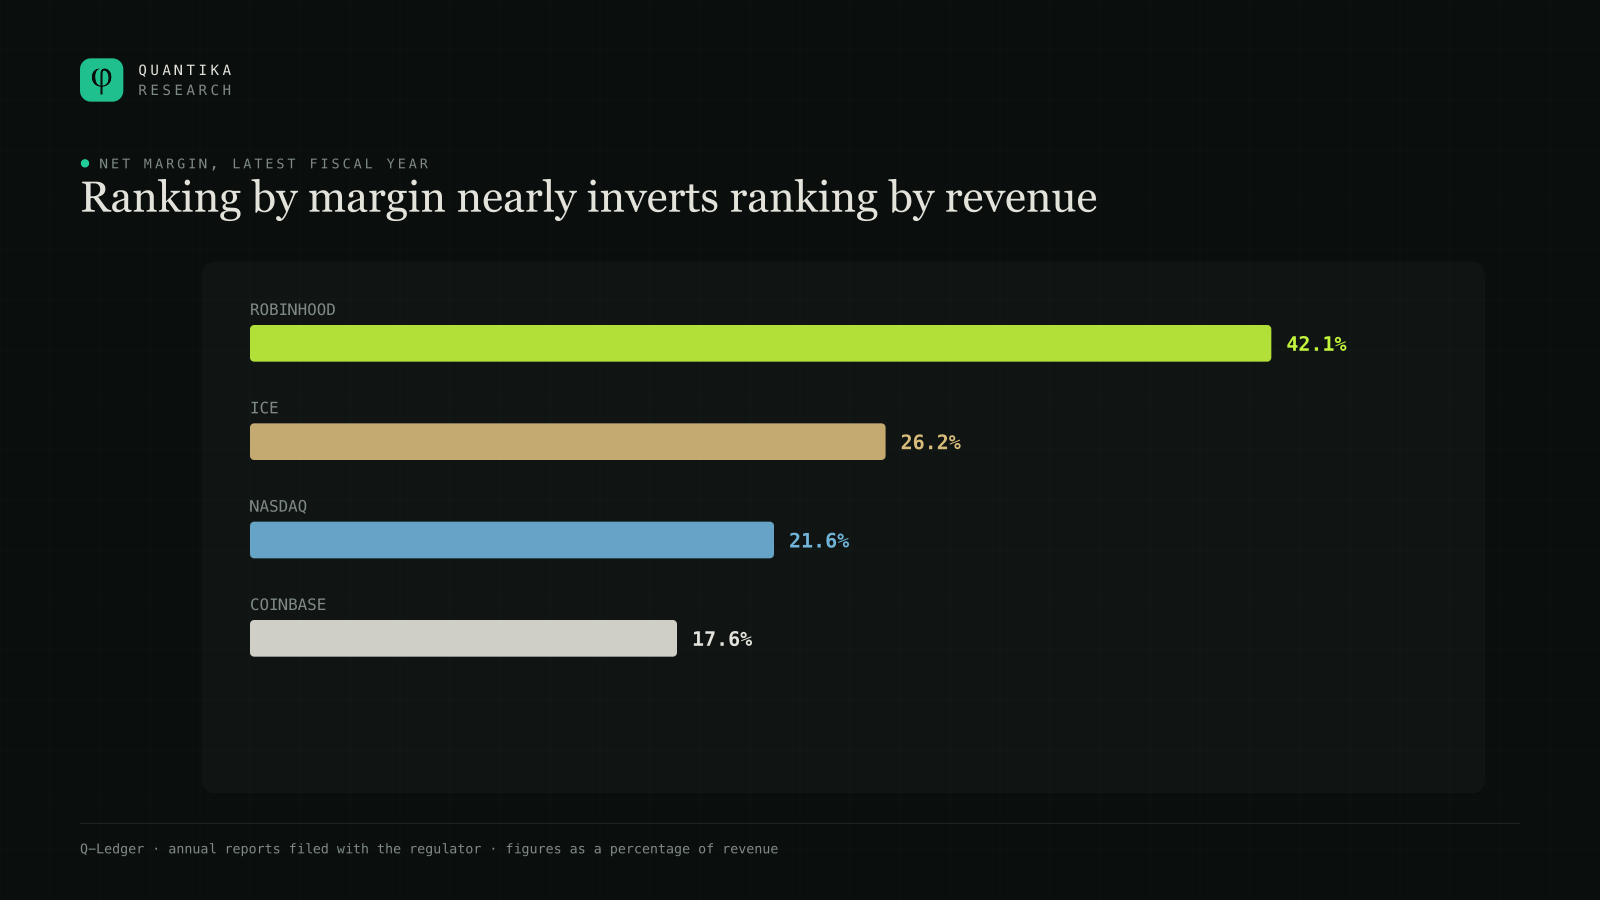
By revenue the order is ICE, Nasdaq, Coinbase, Robinhood. By net margin it is almost the reverse: Robinhood, ICE, Nasdaq, Coinbase. The smallest of the four by billing is the one that keeps the most of every dollar.
Remember the asterisk from the previous section: Robinhood's 2025 margin no longer includes the 2024 tax benefit, so that 42.1% is clean in that sense. And remember too that a high margin describes one fiscal year, not a guarantee about the next.
Size and profitability are two different questions, and the ranking changes depending on which one you ask. Ordering by revenue is the most common way to compare companies, and also one of the least informative.
Galaxy Digital: why you must open a figure before comparing it
One last case, and it is of a different nature: Galaxy Digital was not at that meeting. It is included because it teaches something none of the previous four teaches as well.
Galaxy reported $60,244 million in revenue for 2025. That is 7.3 times Nasdaq's. Now the expenses for the same year: $183 million of general and administrative, $300 million of compensation and employee benefits, and $75 million of professional fees.
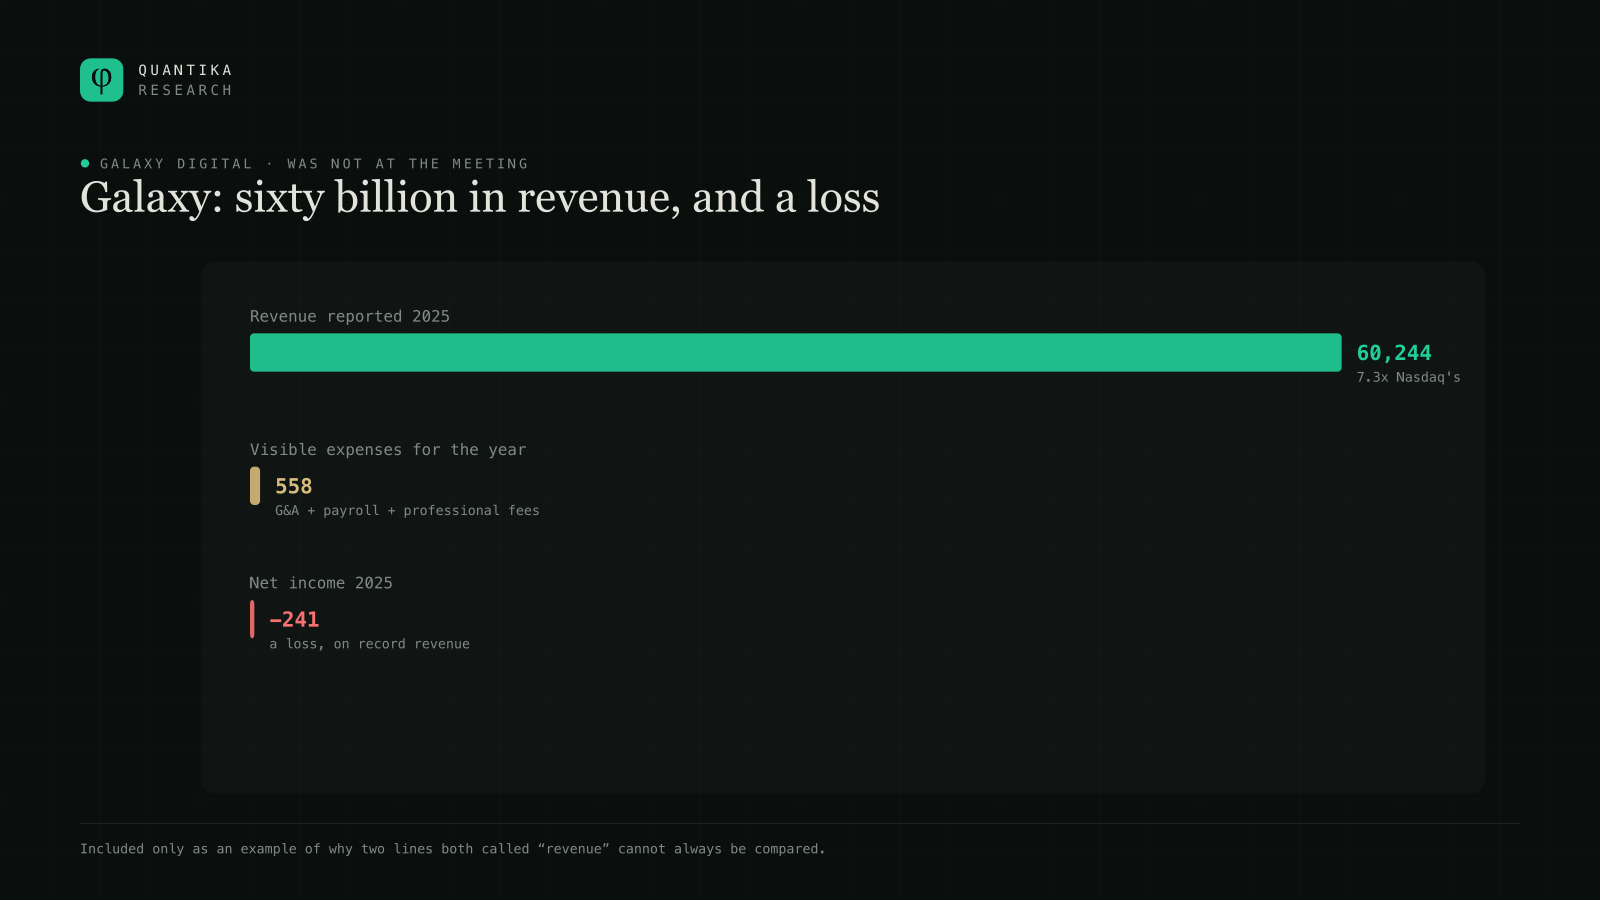
Sixty billion dollars of revenue against some five hundred and fifty million of visible expenses does not describe any operating company. It describes something else: a digital-asset trading desk, where that line captures the gross amount passing through its hands, not what it earns for doing so. The bottom line confirms it: on that record revenue, Galaxy lost $241 million.
The lesson is not about Galaxy. It is that two companies can call “revenue” magnitudes that cannot be added on the same chart. Before comparing two figures with the same name, you have to open each one and see what it holds.
What these accounts do not say
To recap what they do say. Coinbase has still not returned to its 2021 revenue, and its latest year grew in revenue while shrinking in profit because expenses grew two and a half times faster. Robinhood multiplied its revenue by 2.46 in four years, with one year in between that carried an unrepeatable tax benefit inside it. Nasdaq and Intercontinental Exchange grew around 40% over five years without meaningfully moving their margins. And a fifth company shows that the word “revenue” does not mean the same thing in every set of financial statements.
- They do not say whether any of these stocks is expensive or cheap.
- They do not say what will happen to the CLARITY Act in the Senate.
- They do not say what the price of bitcoin will do.
- They do not say what any of these companies will do next year.
Those are different questions, and none of them is answered by reading an income statement. What an income statement allows is something more modest and more durable: checking, against documents the company itself signed, what actually happened.
Sources
- Annual reports filed with the regulatorFinancial statements of Coinbase Global, Robinhood Markets, Nasdaq, Intercontinental Exchange and Galaxy Digital, extracted line by line from each company's official filings.
- Bitcoin priceDaily market bars from August 12 to 20, 2026.
- The meeting of August 19, 2026Coverage by CoinDesk, The Block and CNBC of the White House event and the list of attendees.
Method note
All figures come from the financial statements each company filed with the regulator and were extracted automatically; the arithmetic relationships were verified one by one before publication. Margin percentages are always calculated over total revenue for the corresponding fiscal year. Galaxy Digital did not attend the meeting and is included solely as a methodological example, flagged as such in its section. This report describes published figures: it does not value any company, does not project future results, does not assess any management team and contains no buy or sell recommendation.